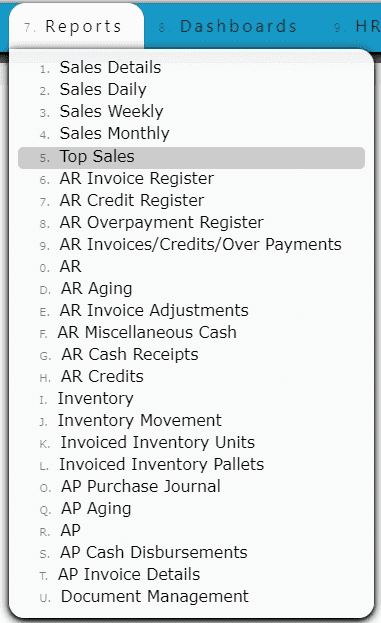
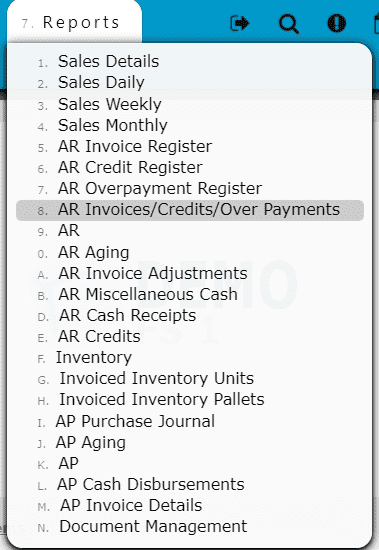
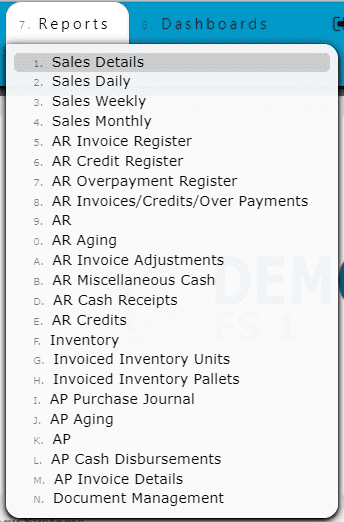
To View the Sales Details Report:
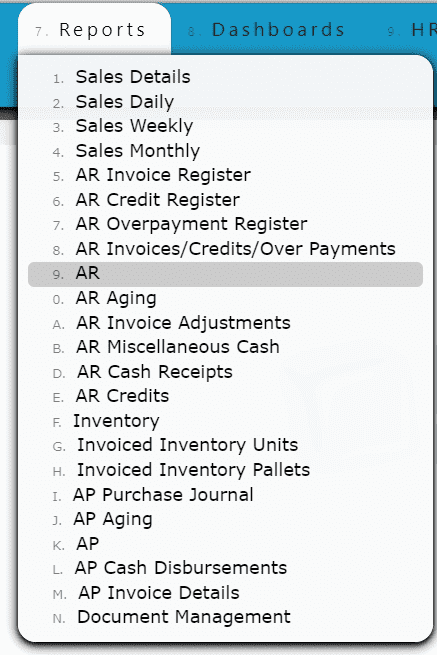
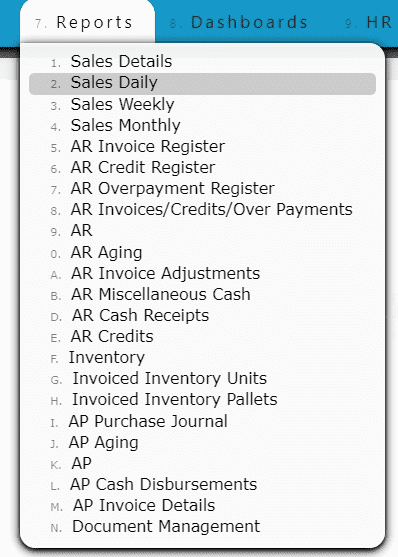
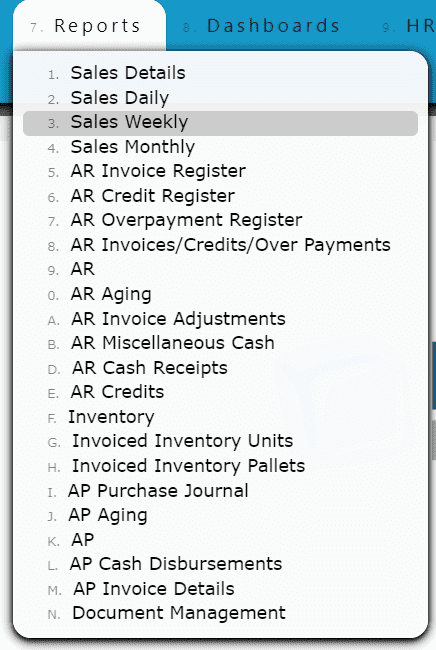
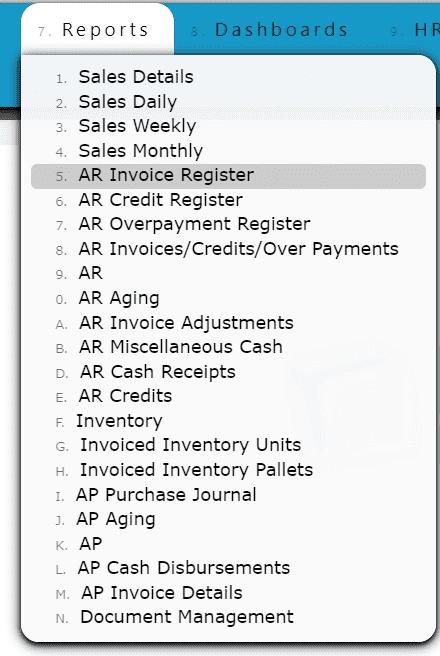
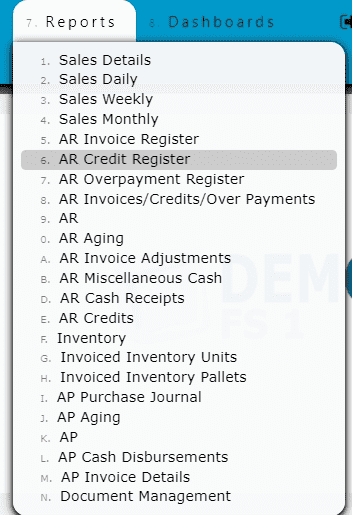
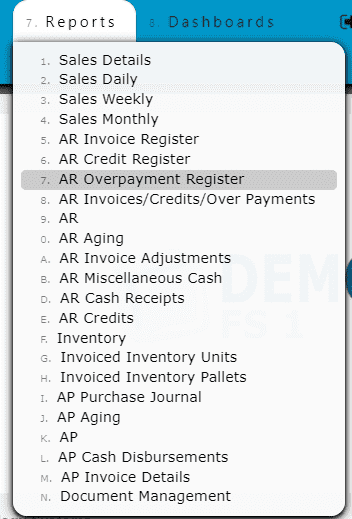
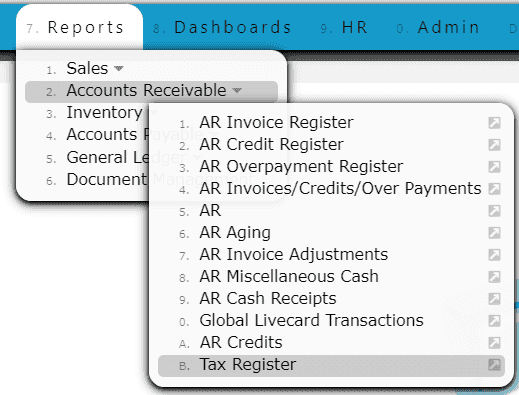
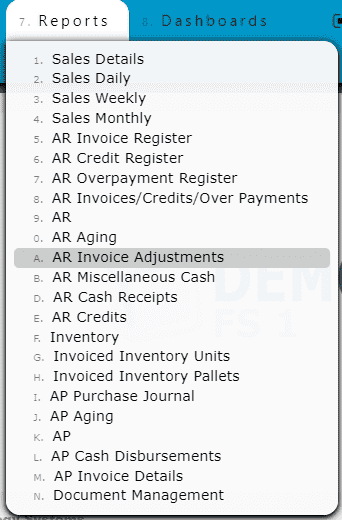
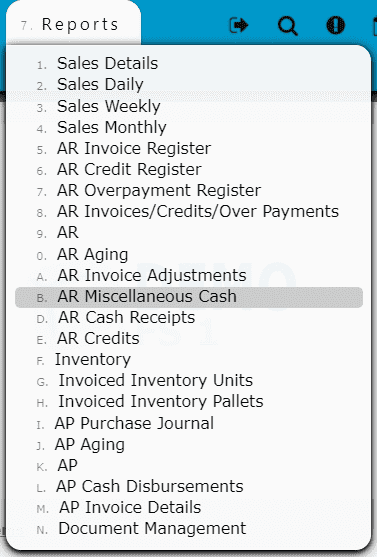
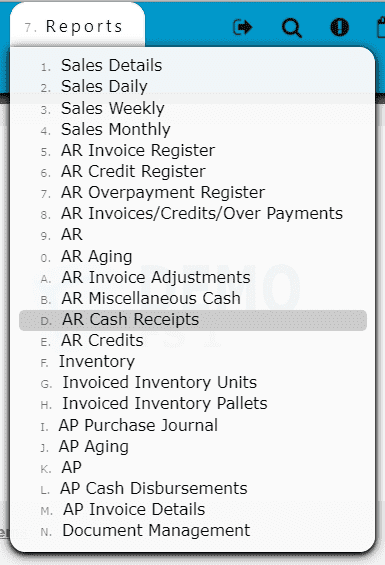
1. Go to the Reports Menu and click on the Sales Details Sub-Menu
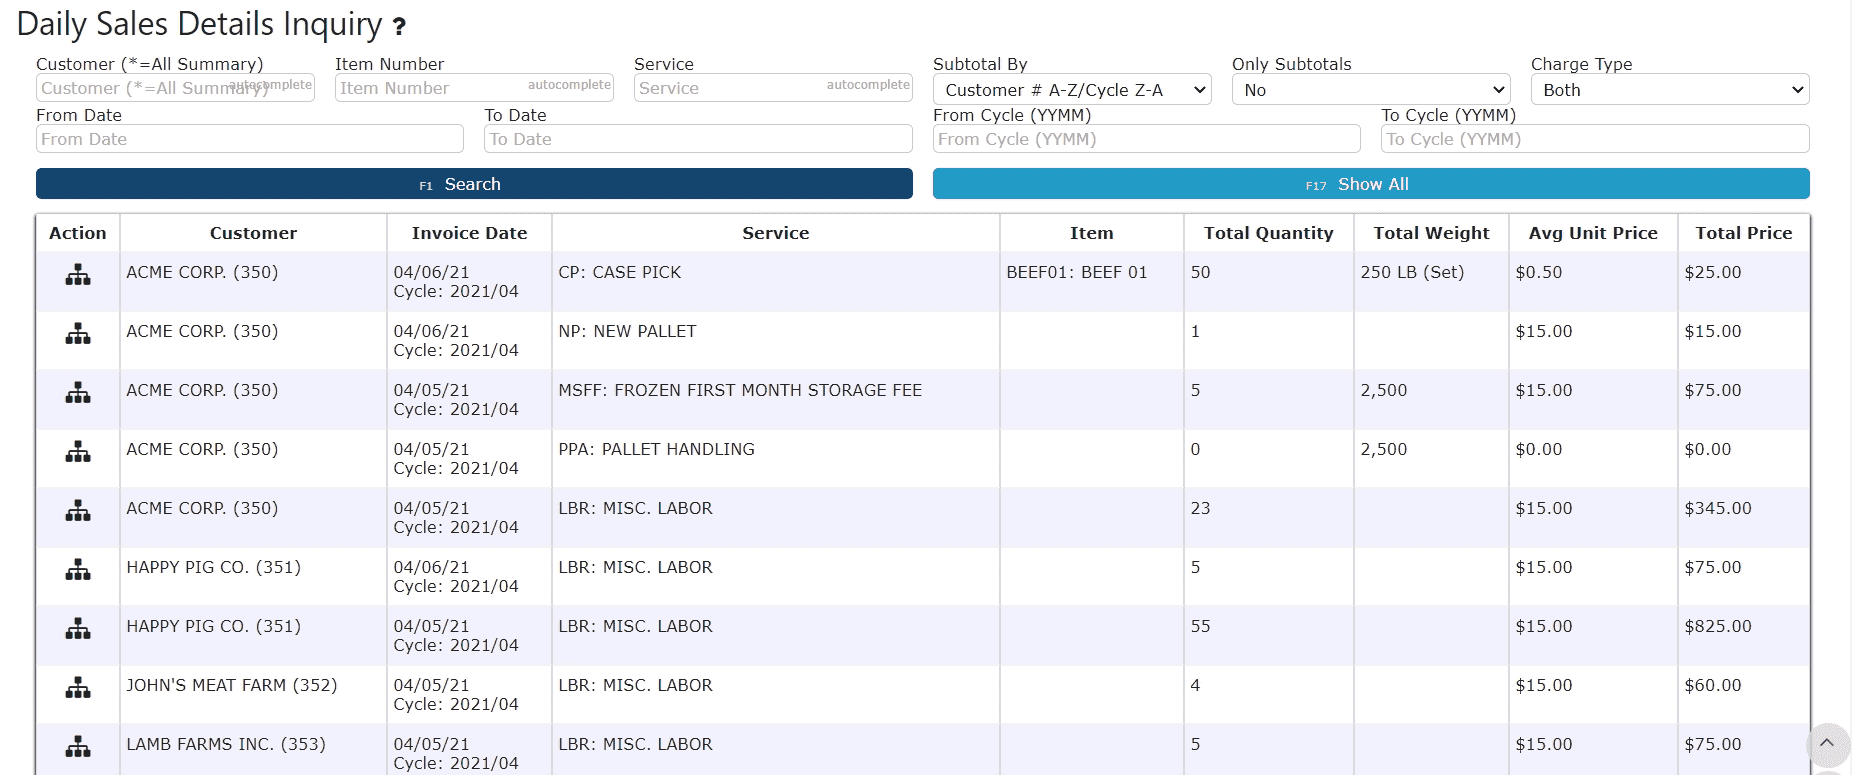
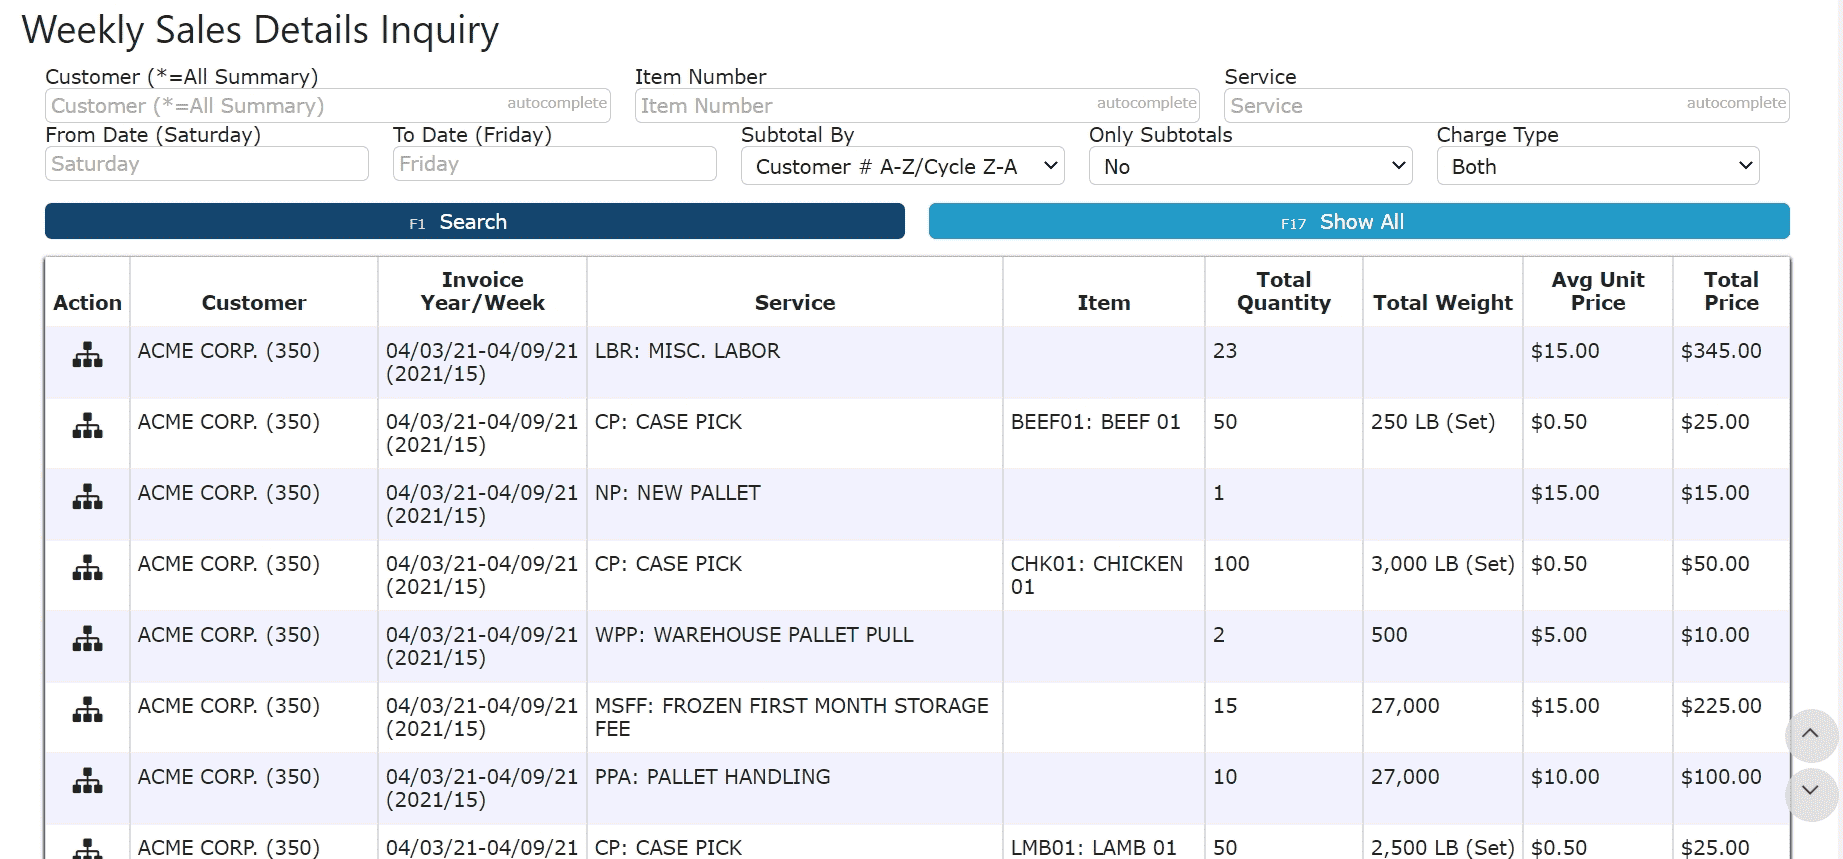
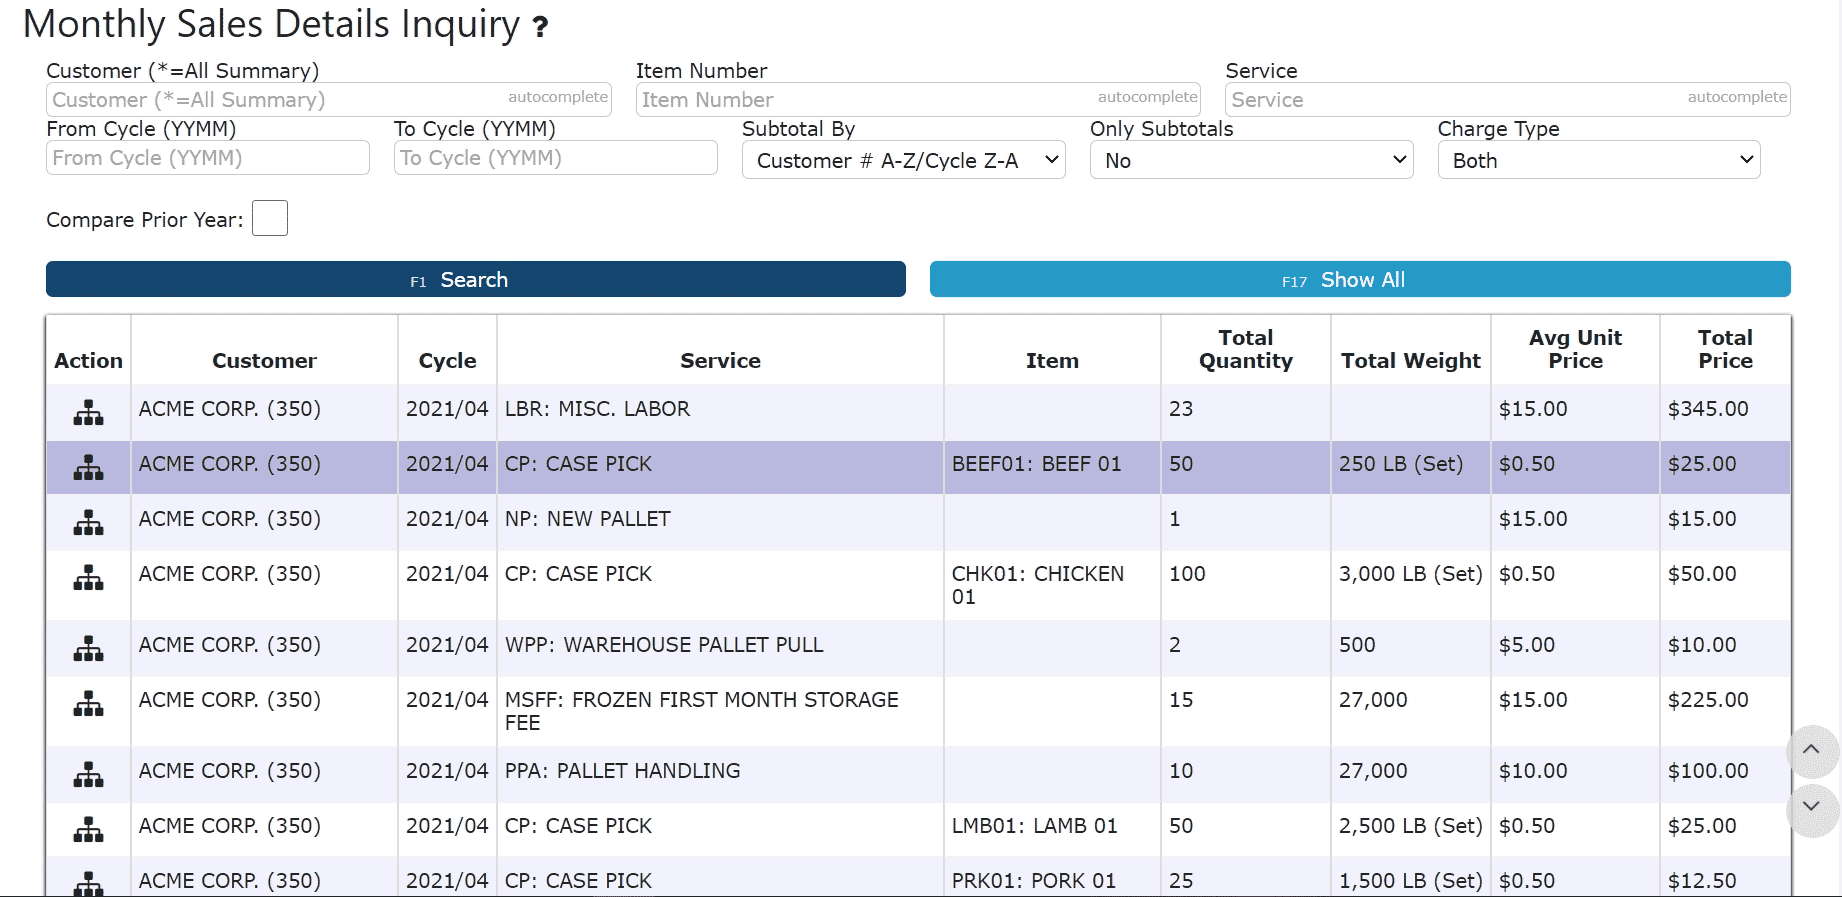
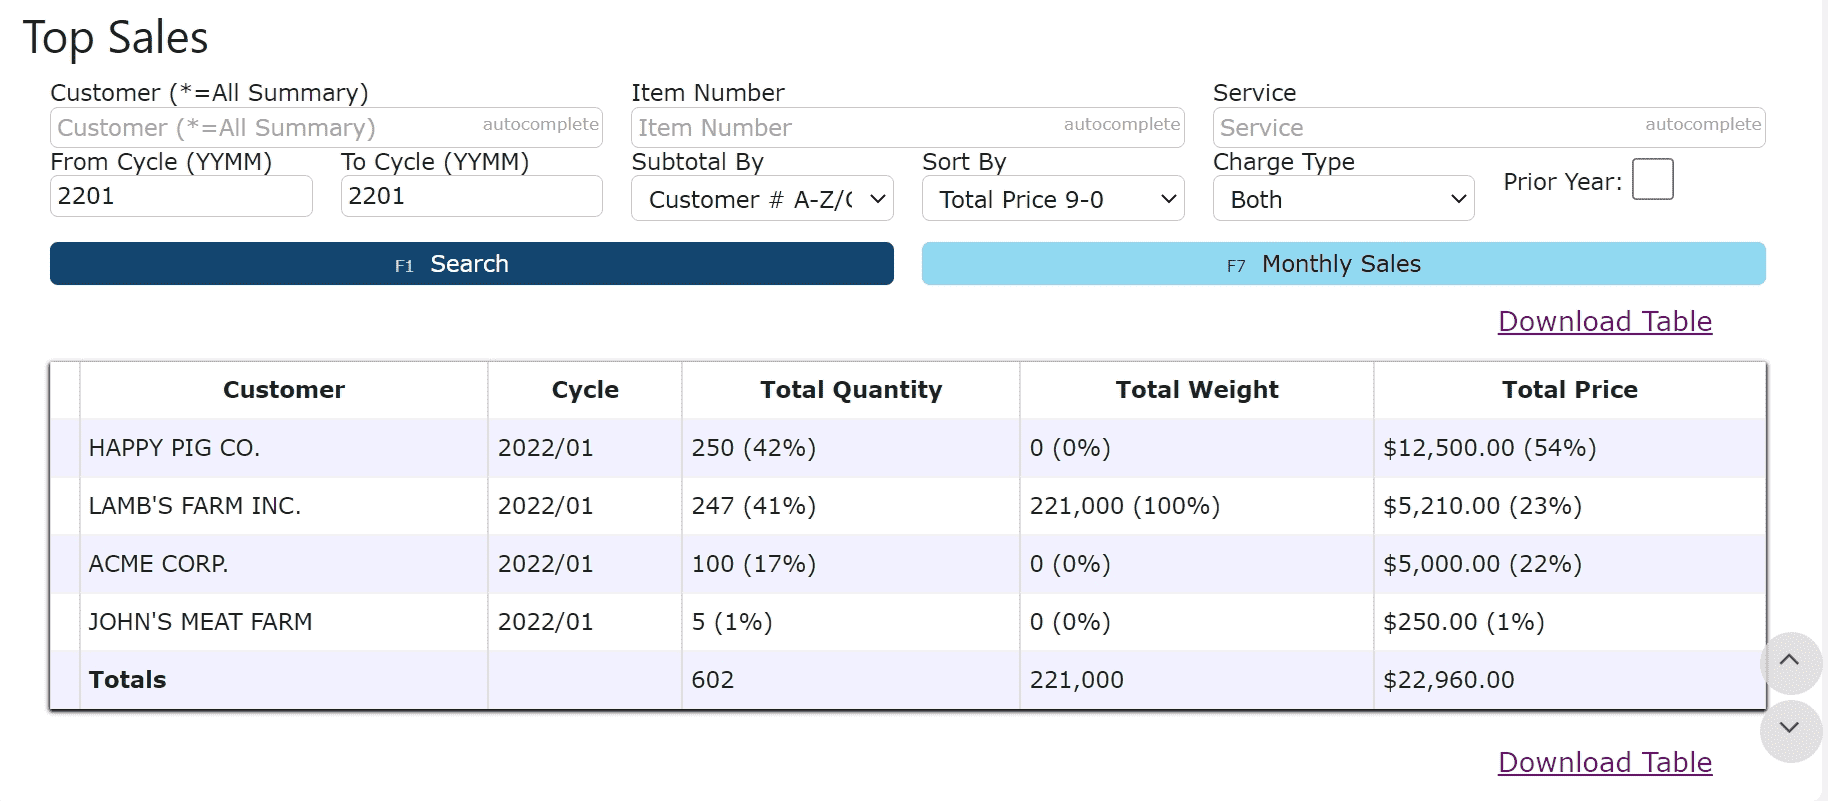
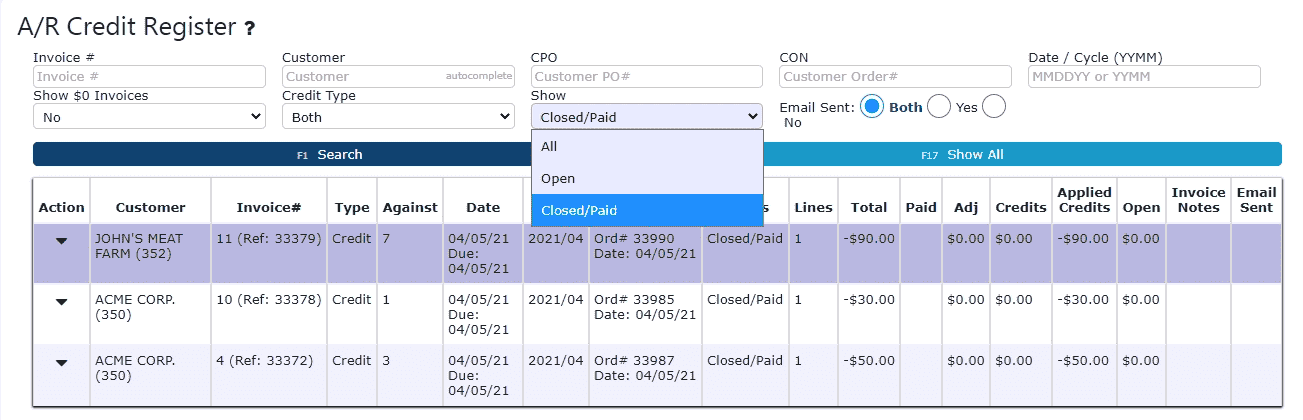
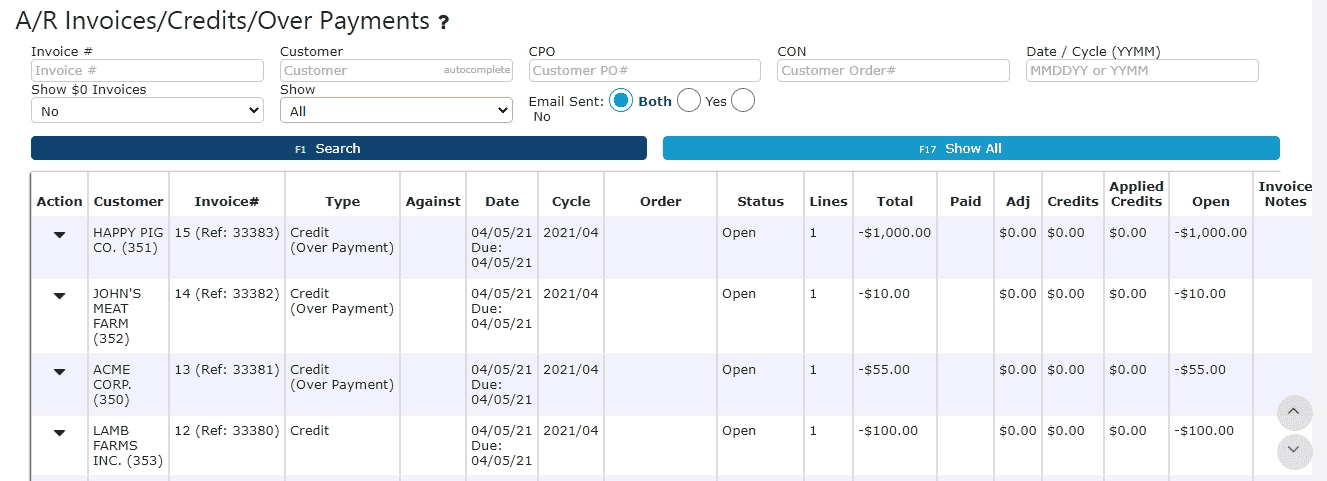
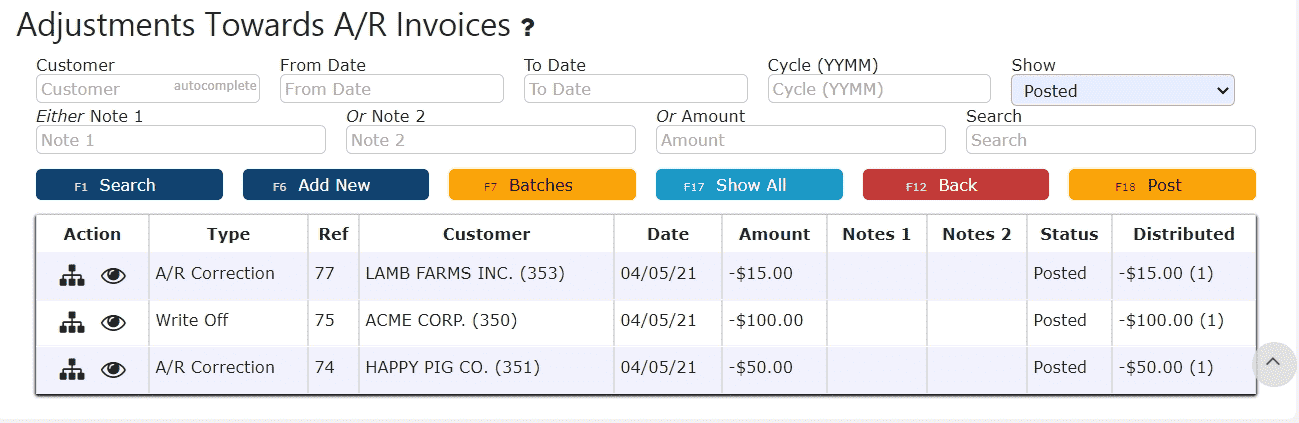
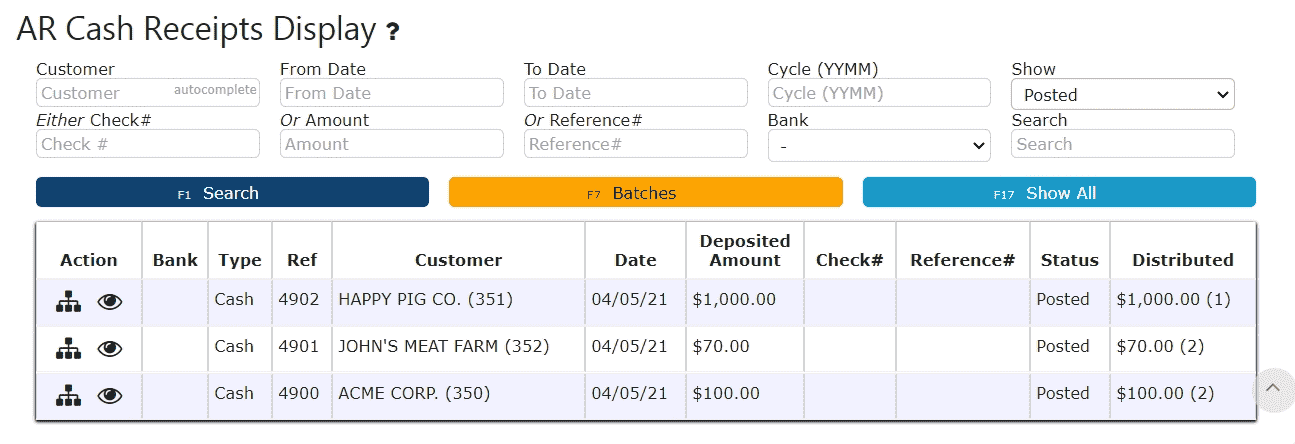
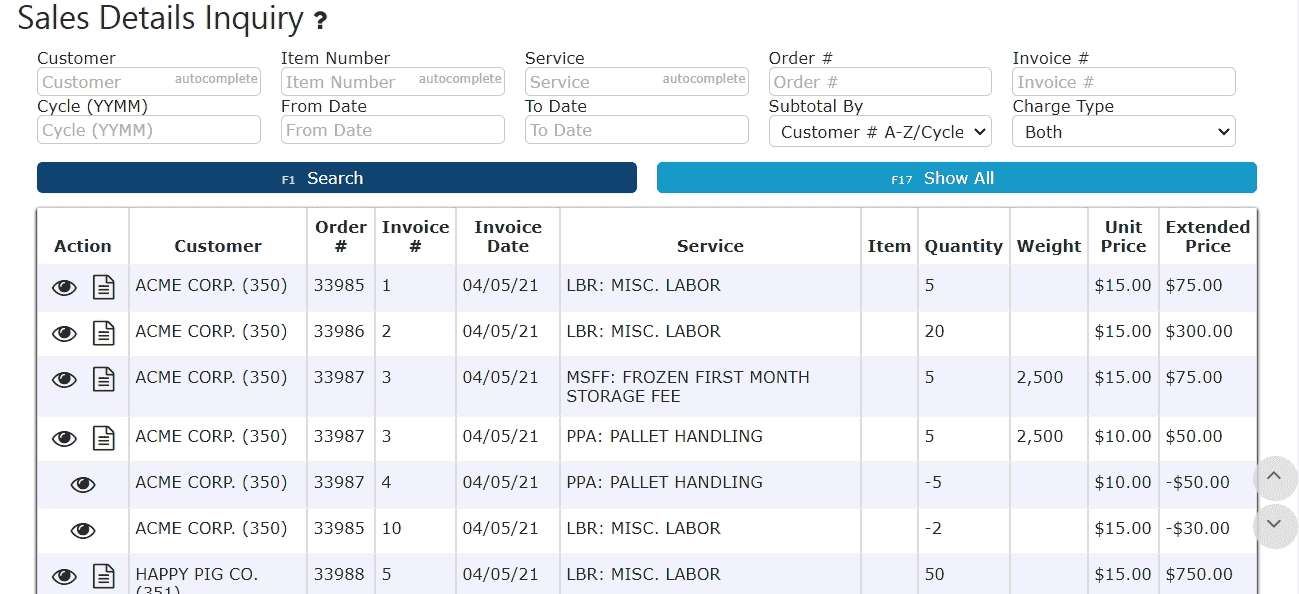
2. You are now viewing all of the sales details (one record per order detail line) across all customers.
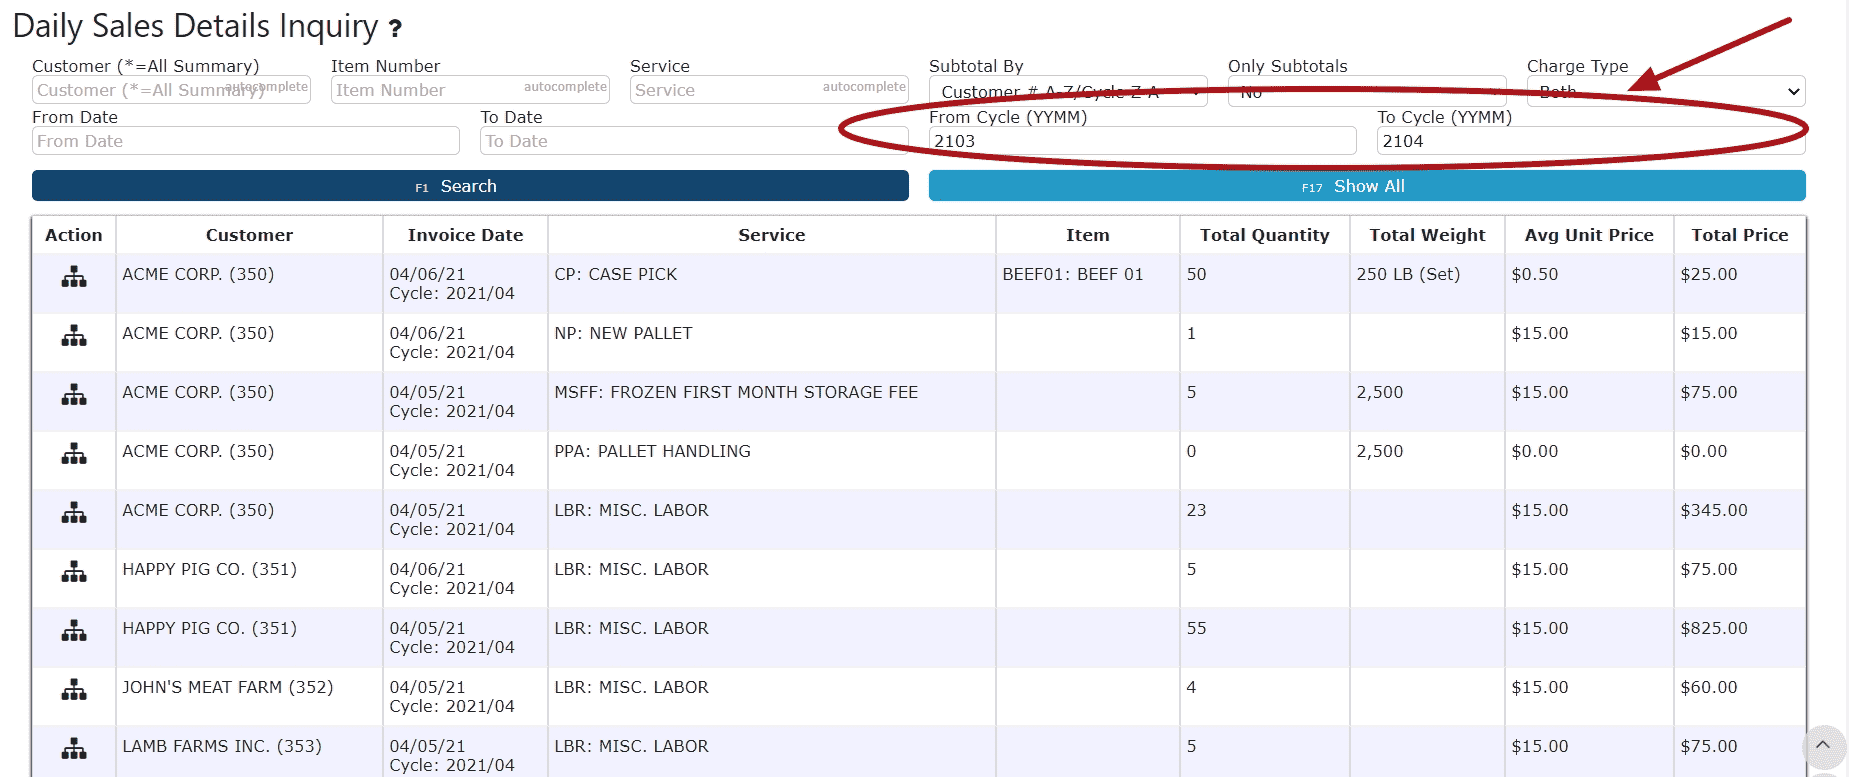
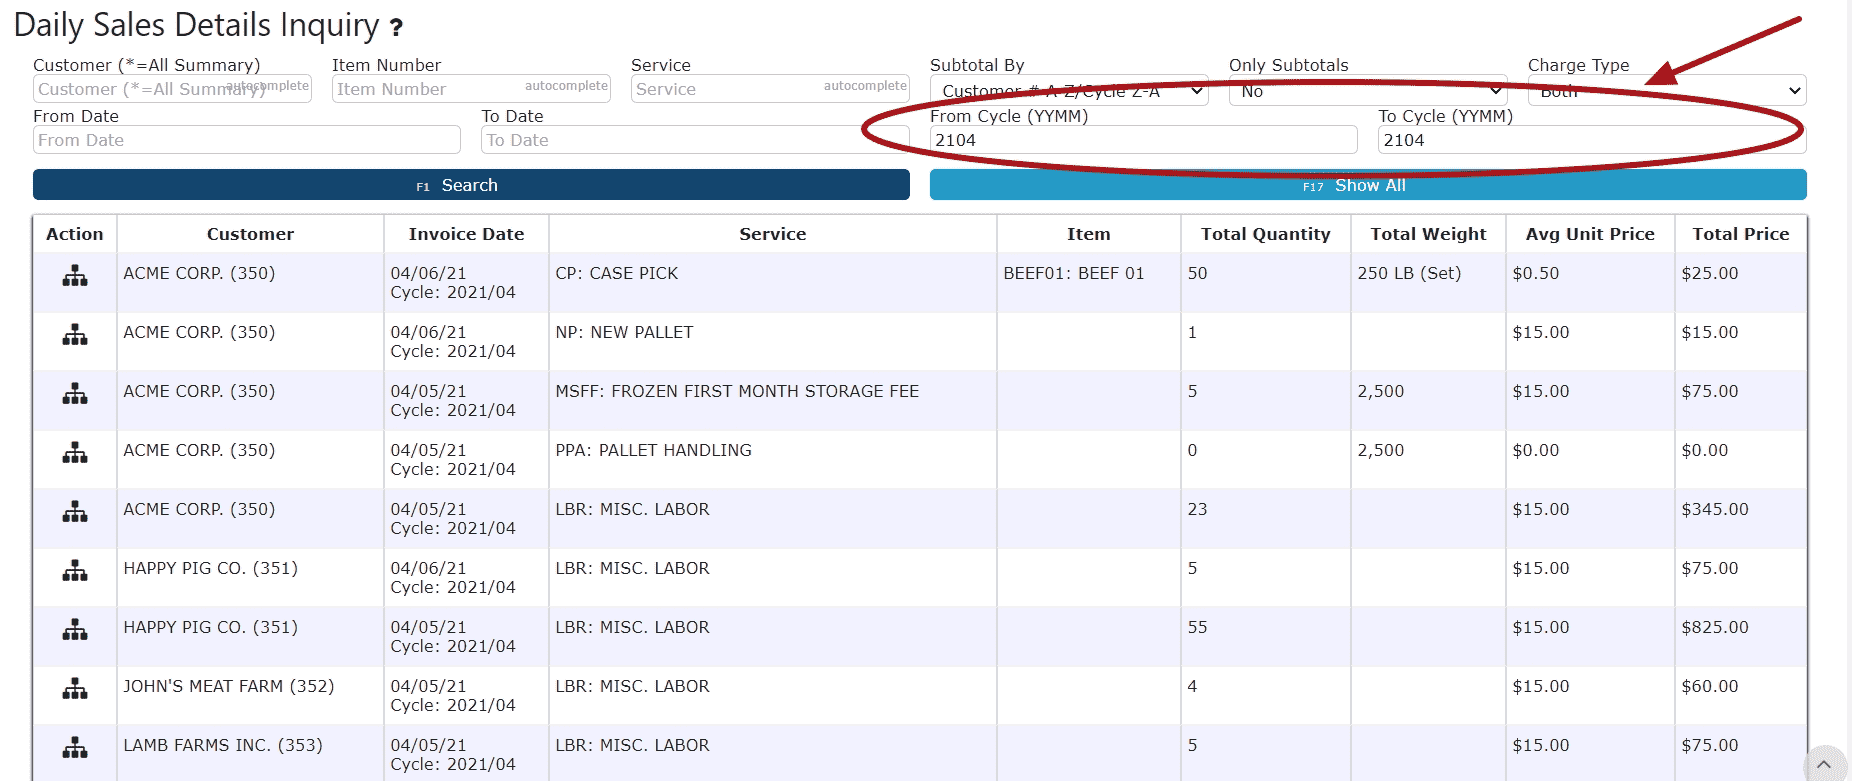
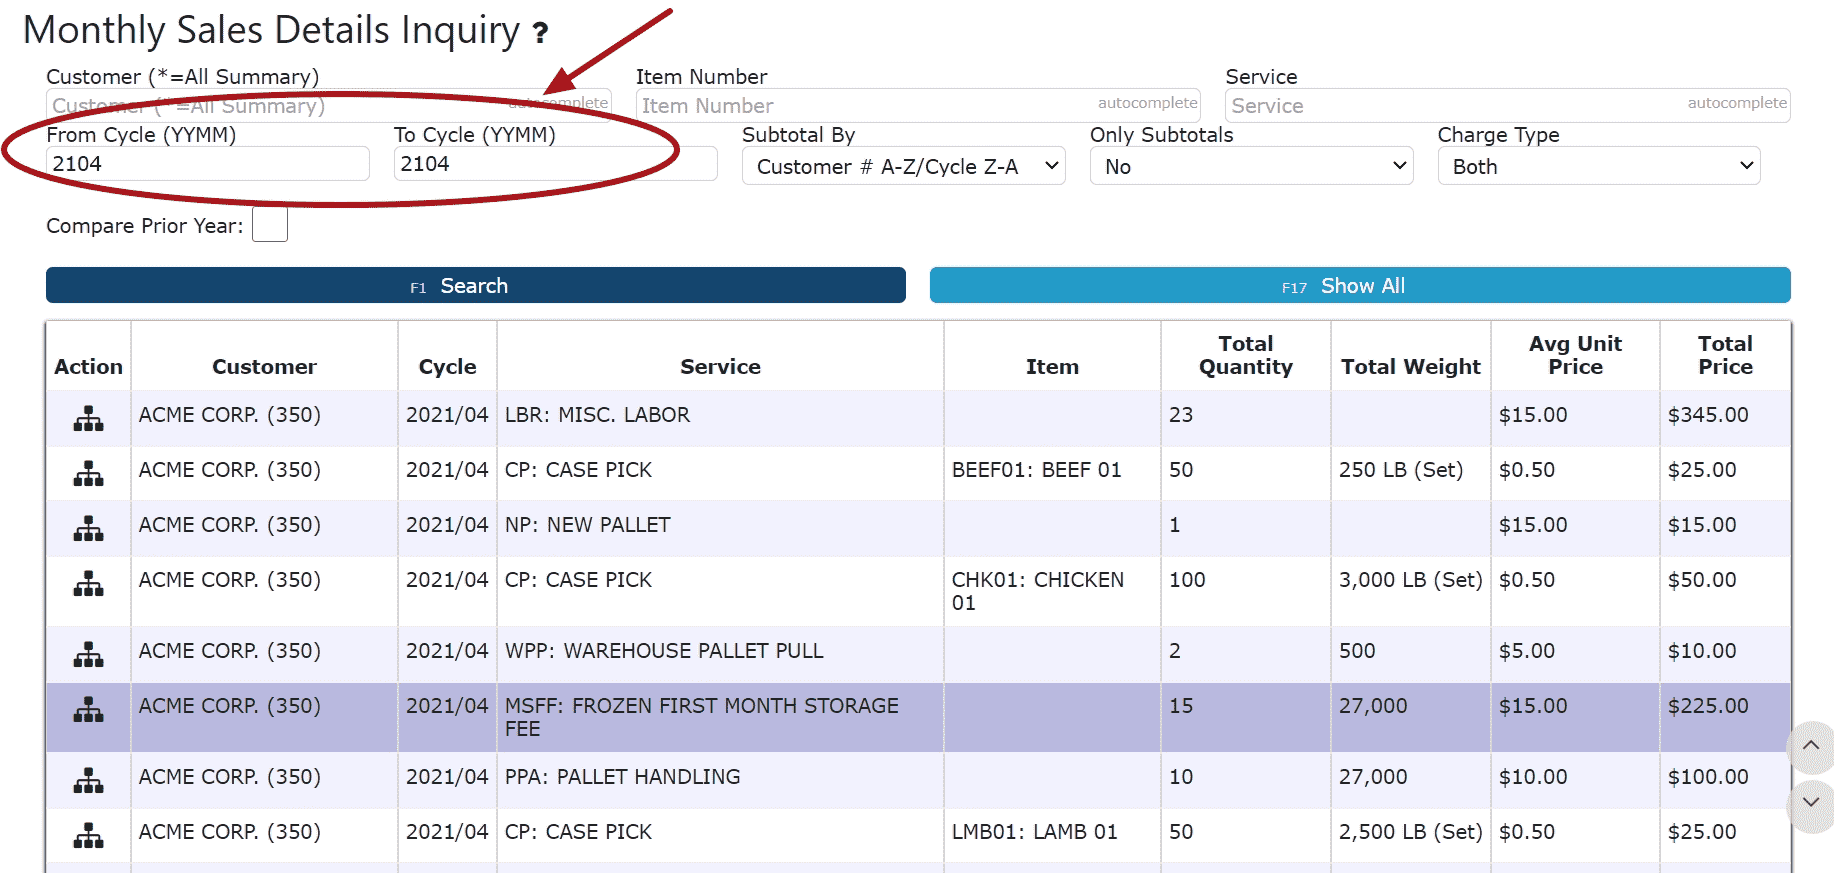
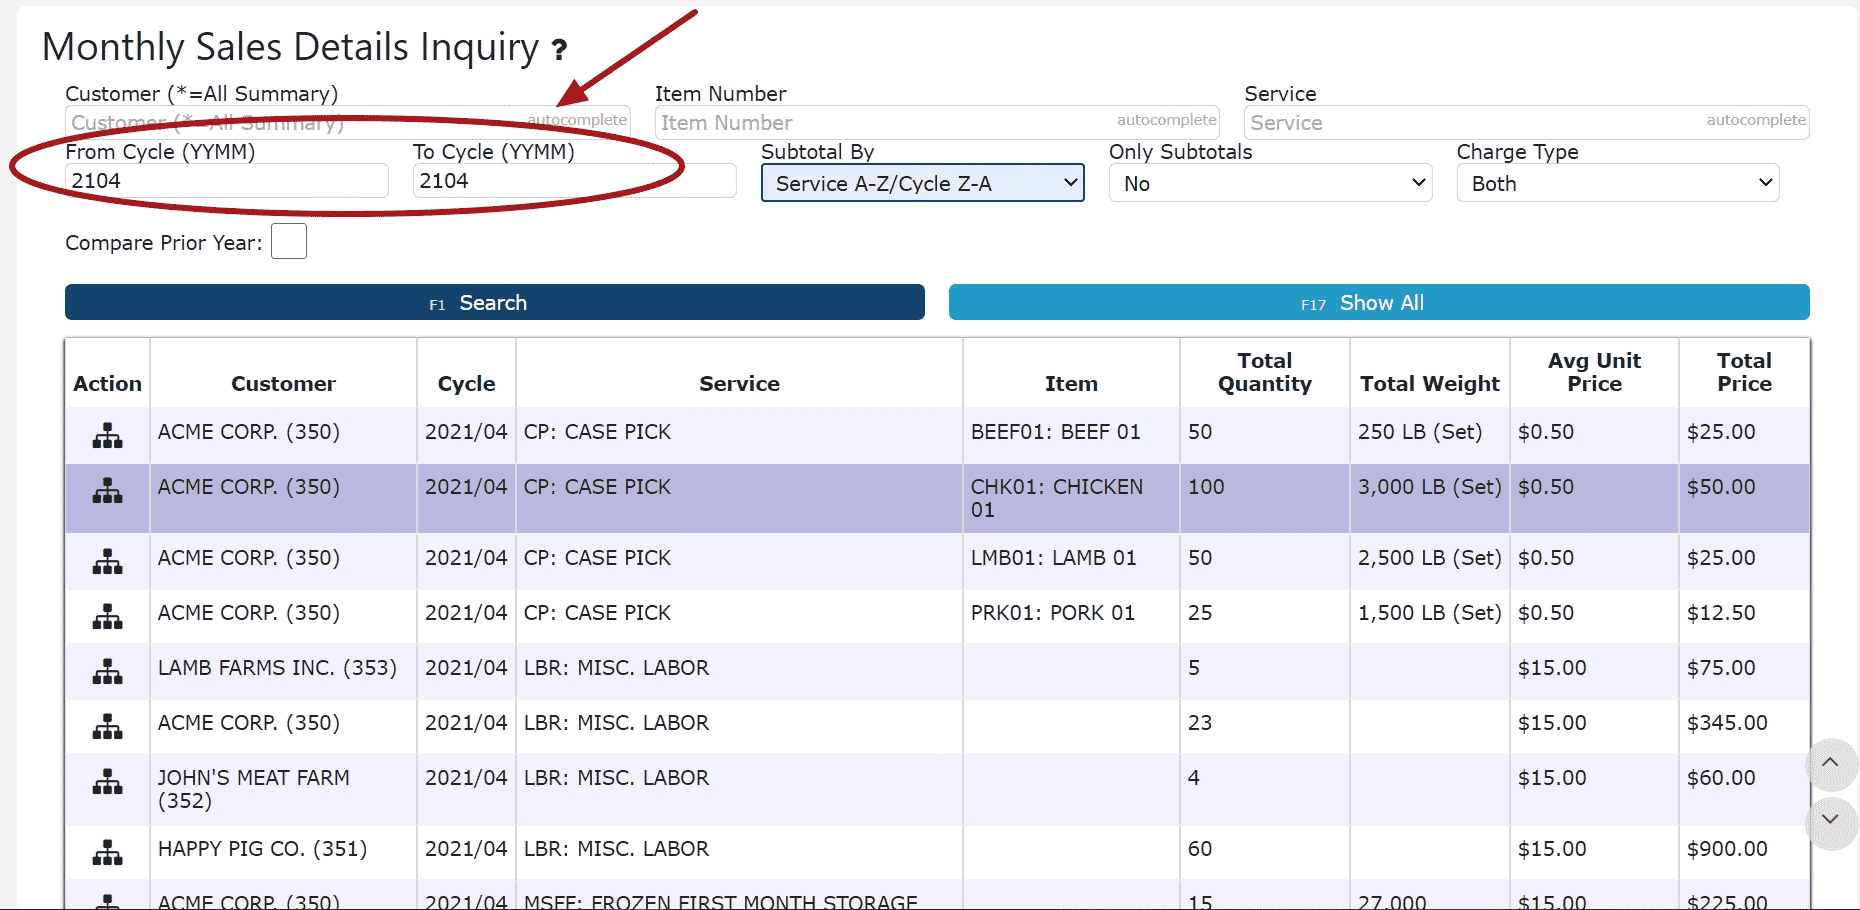
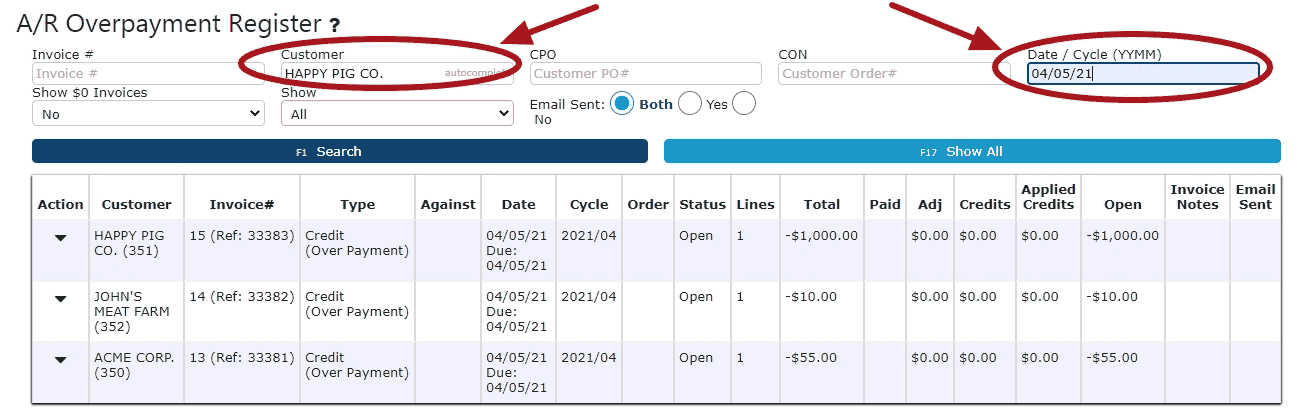
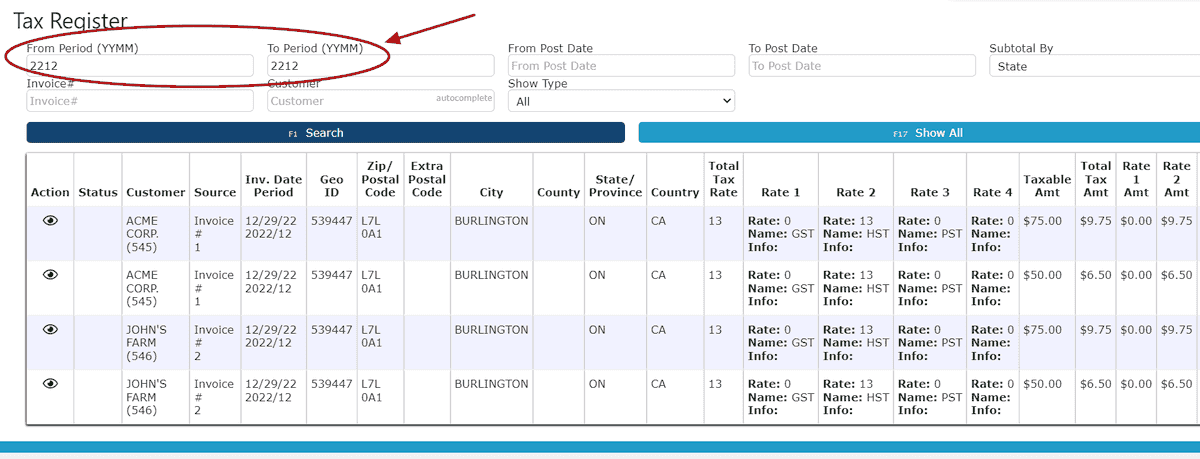
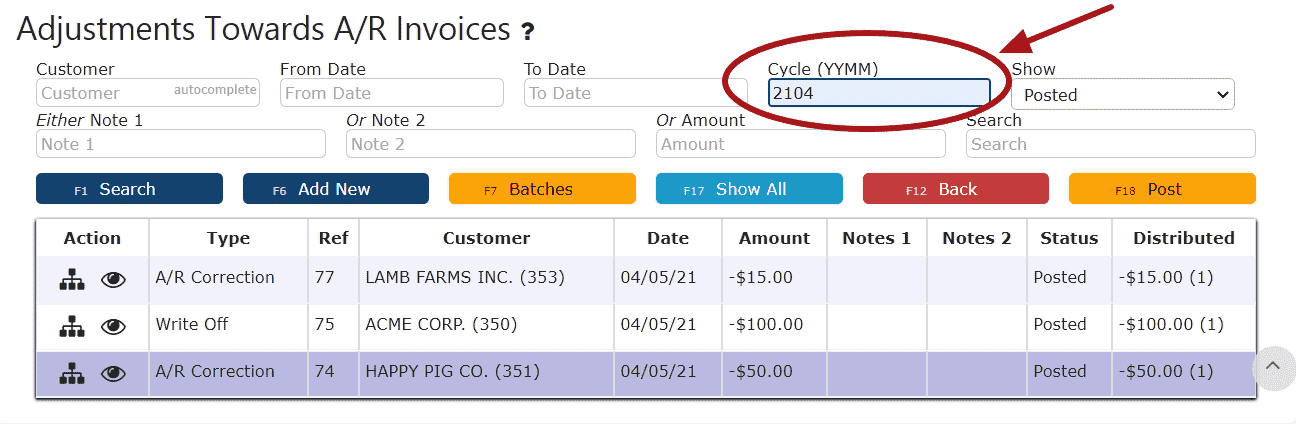
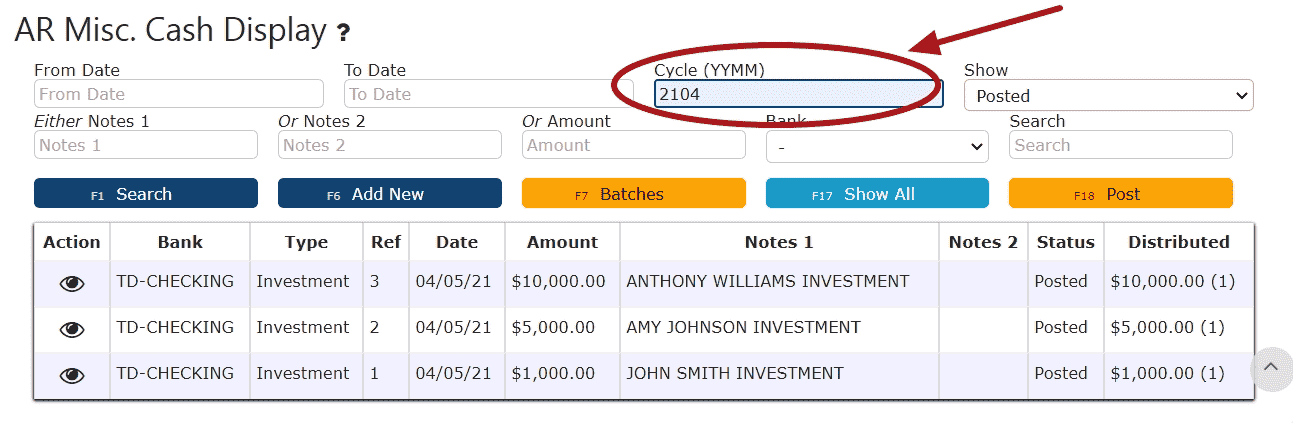
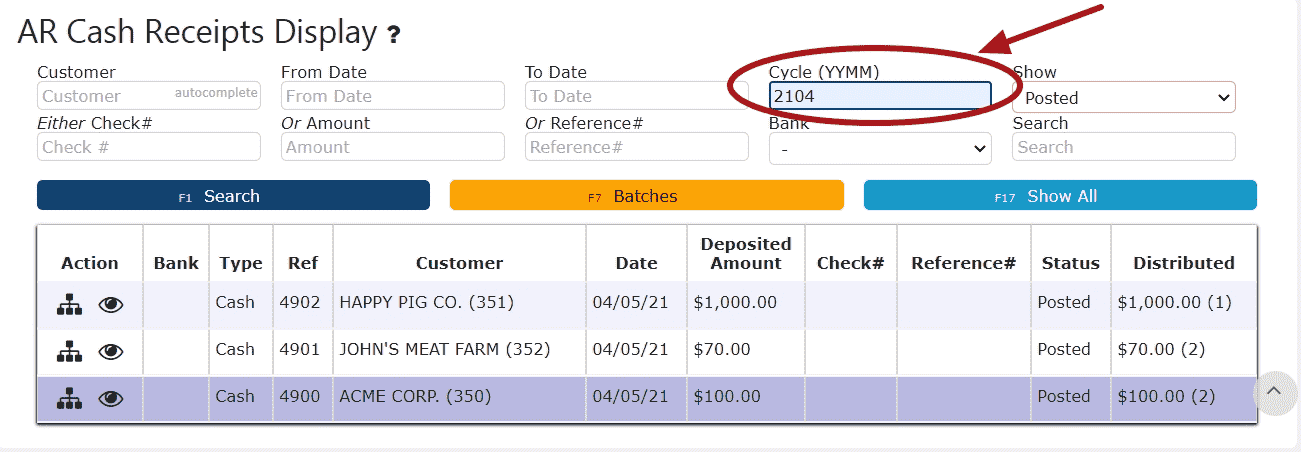
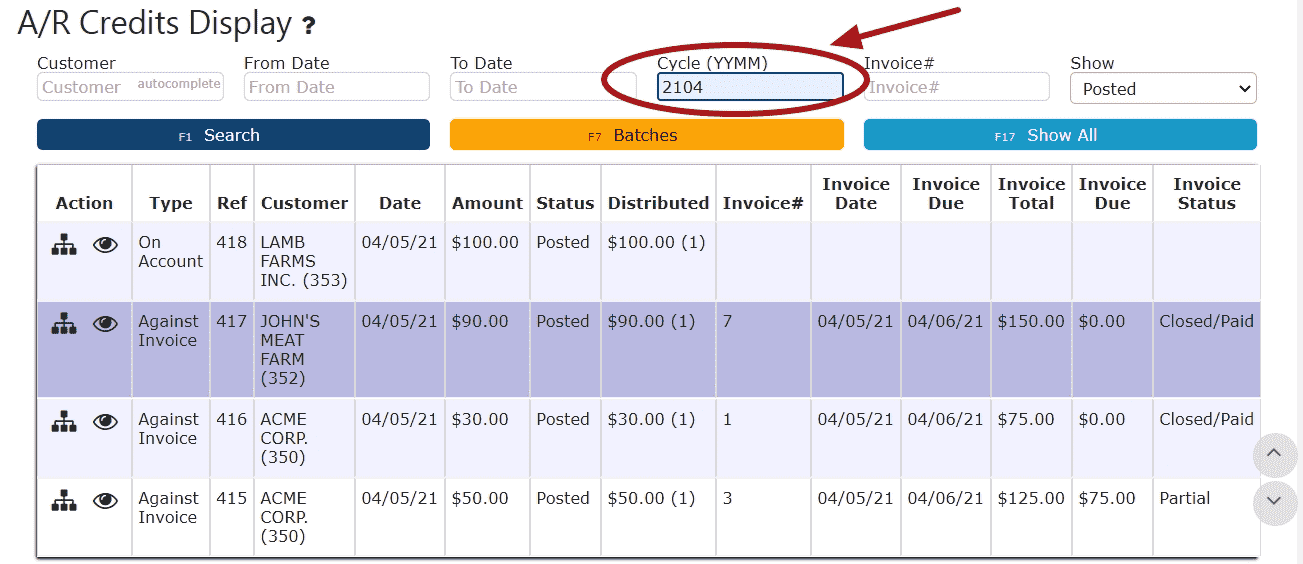
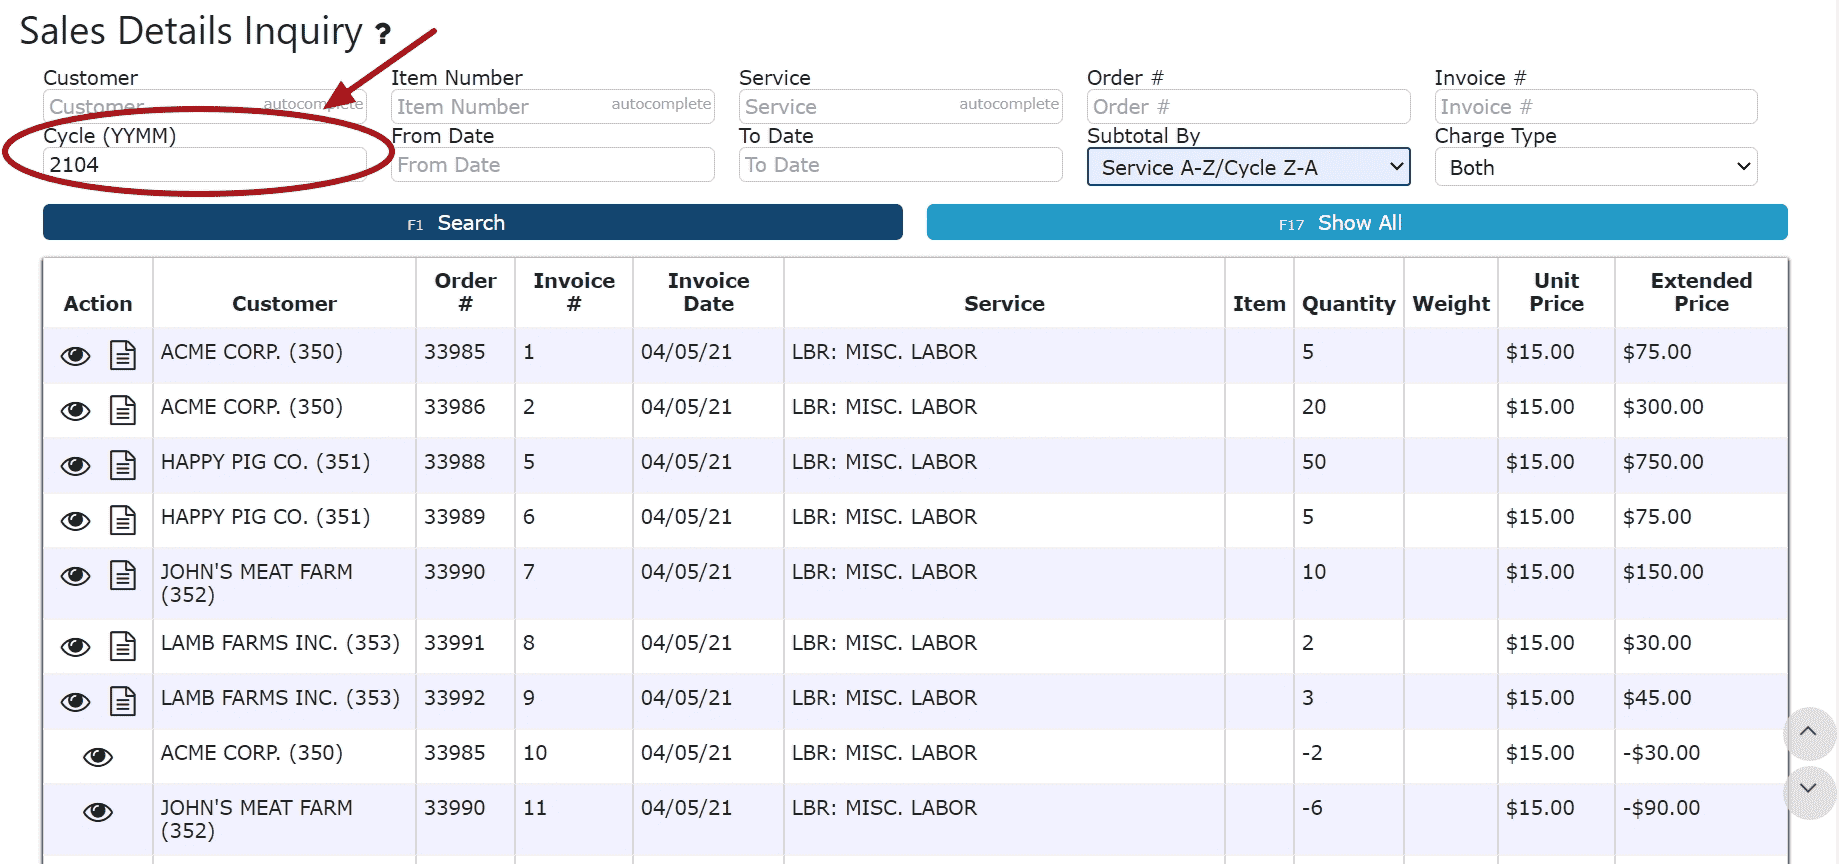
To Limit by Cycle:
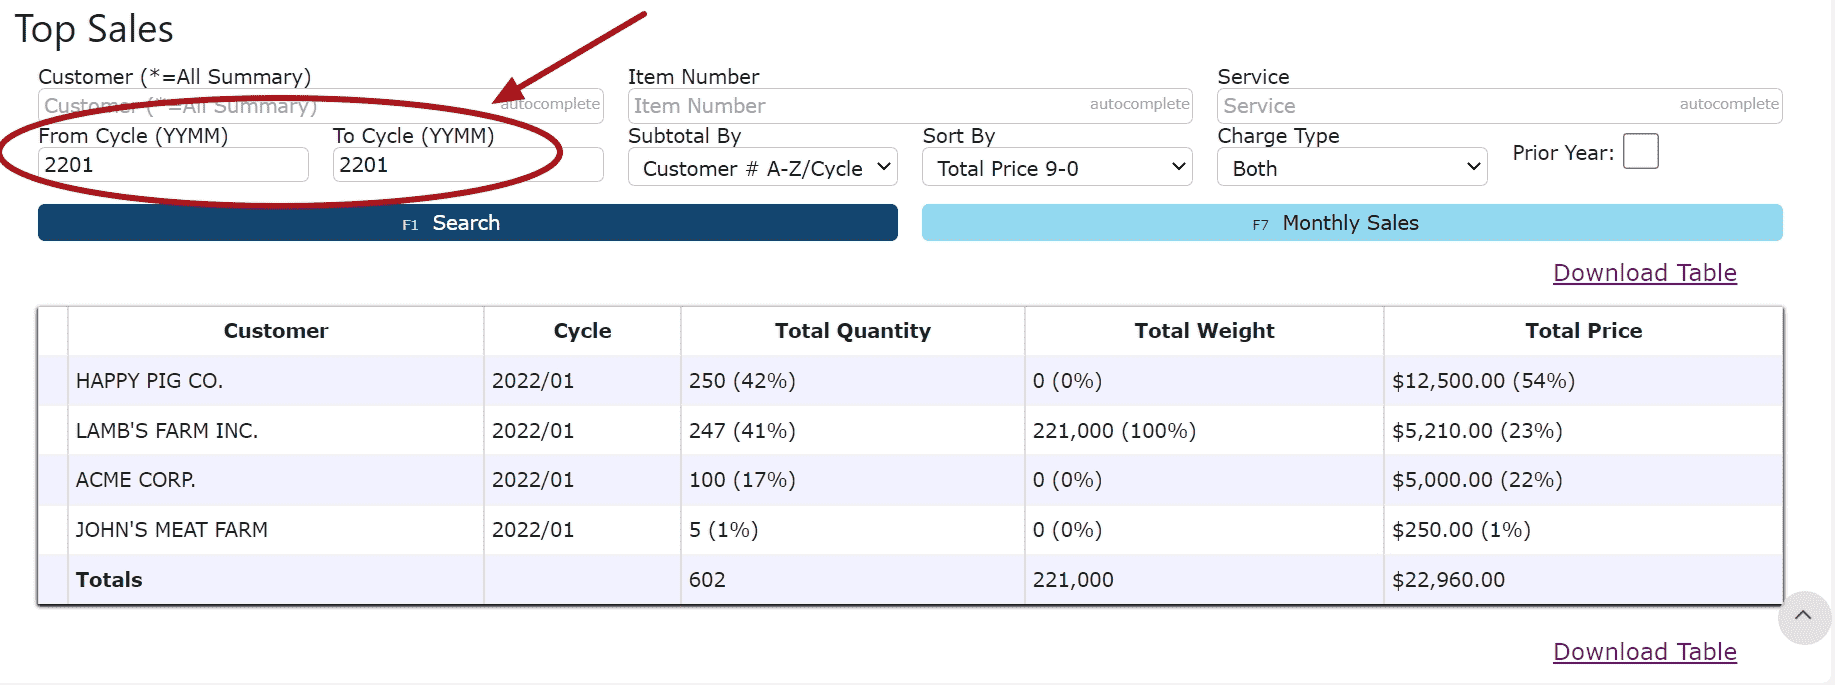
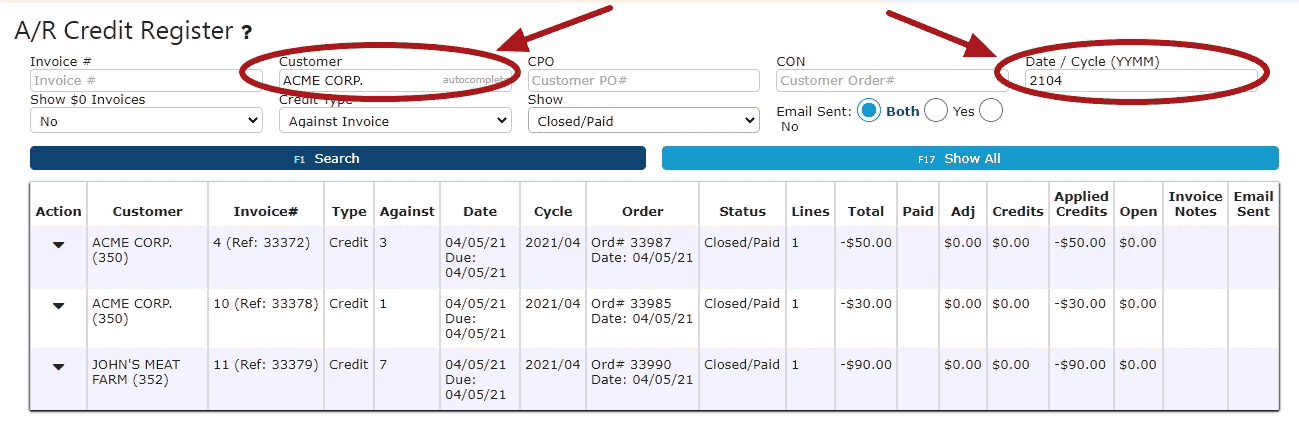
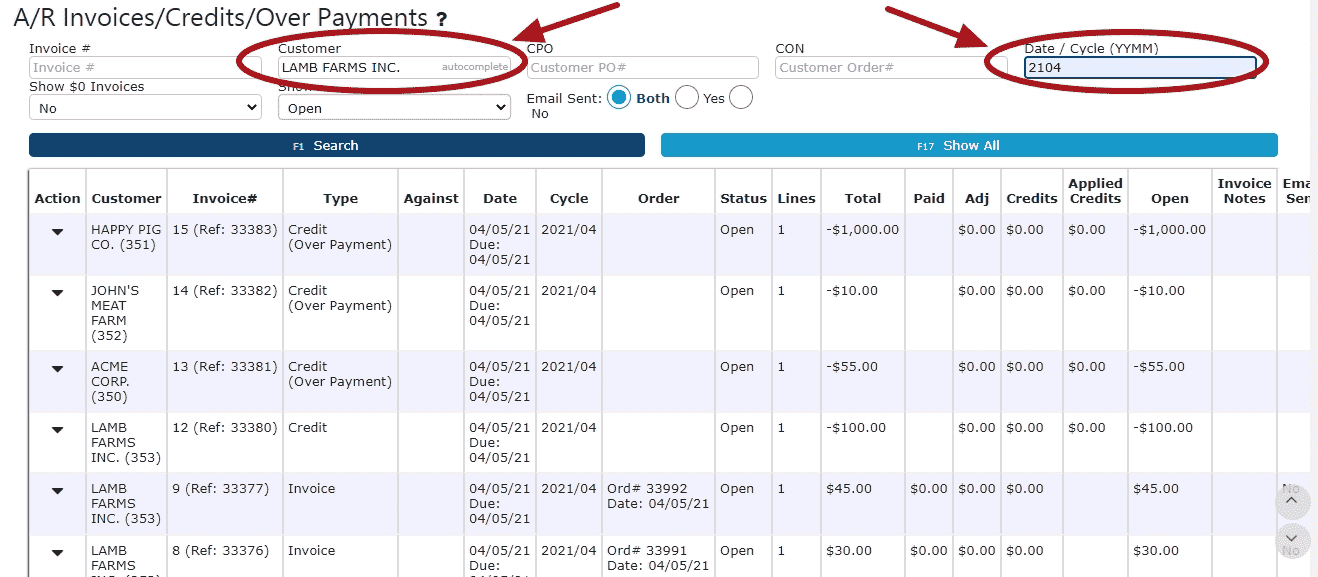
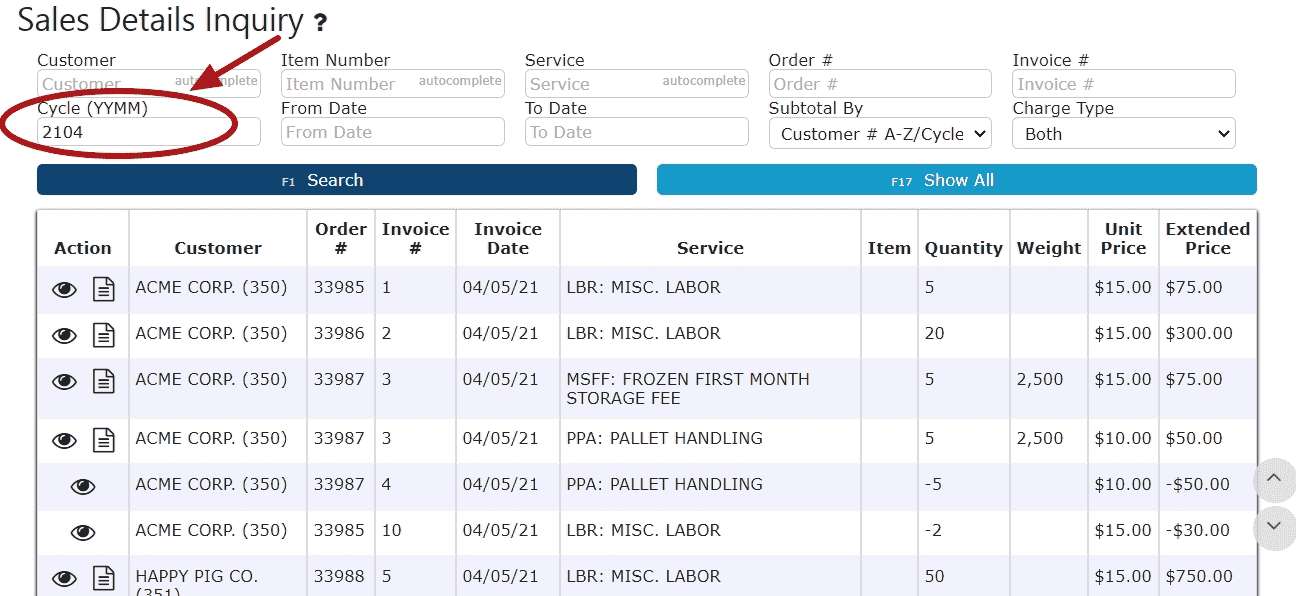
1. Enter a cycle in YYMM format and click the Search Button
Example: Cycle 4 of 2021 -> YYMM = 2104
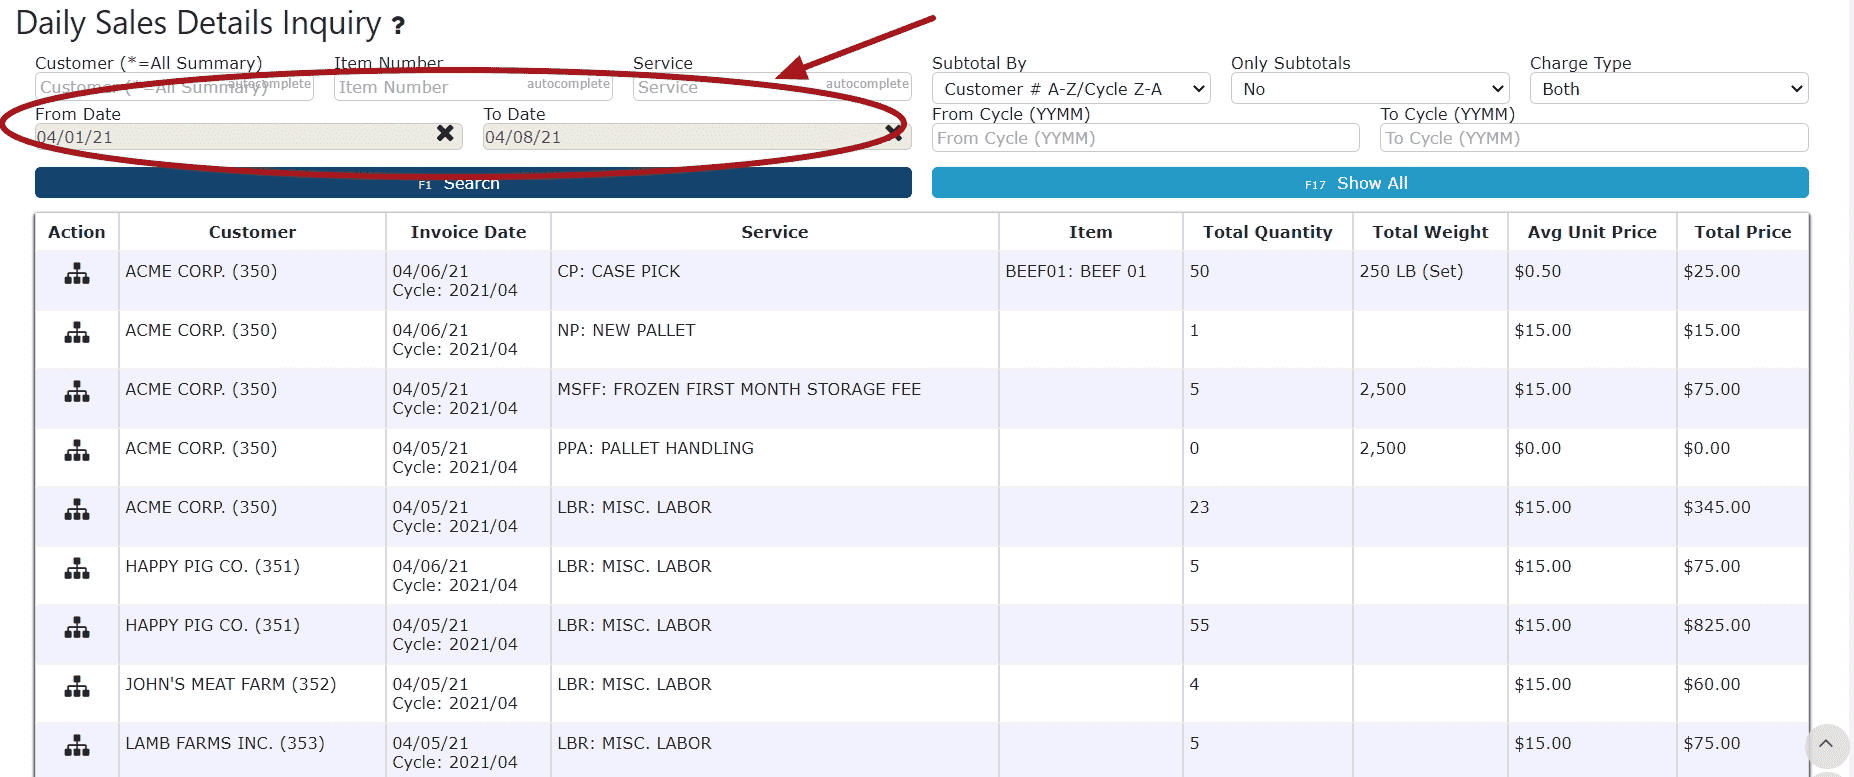
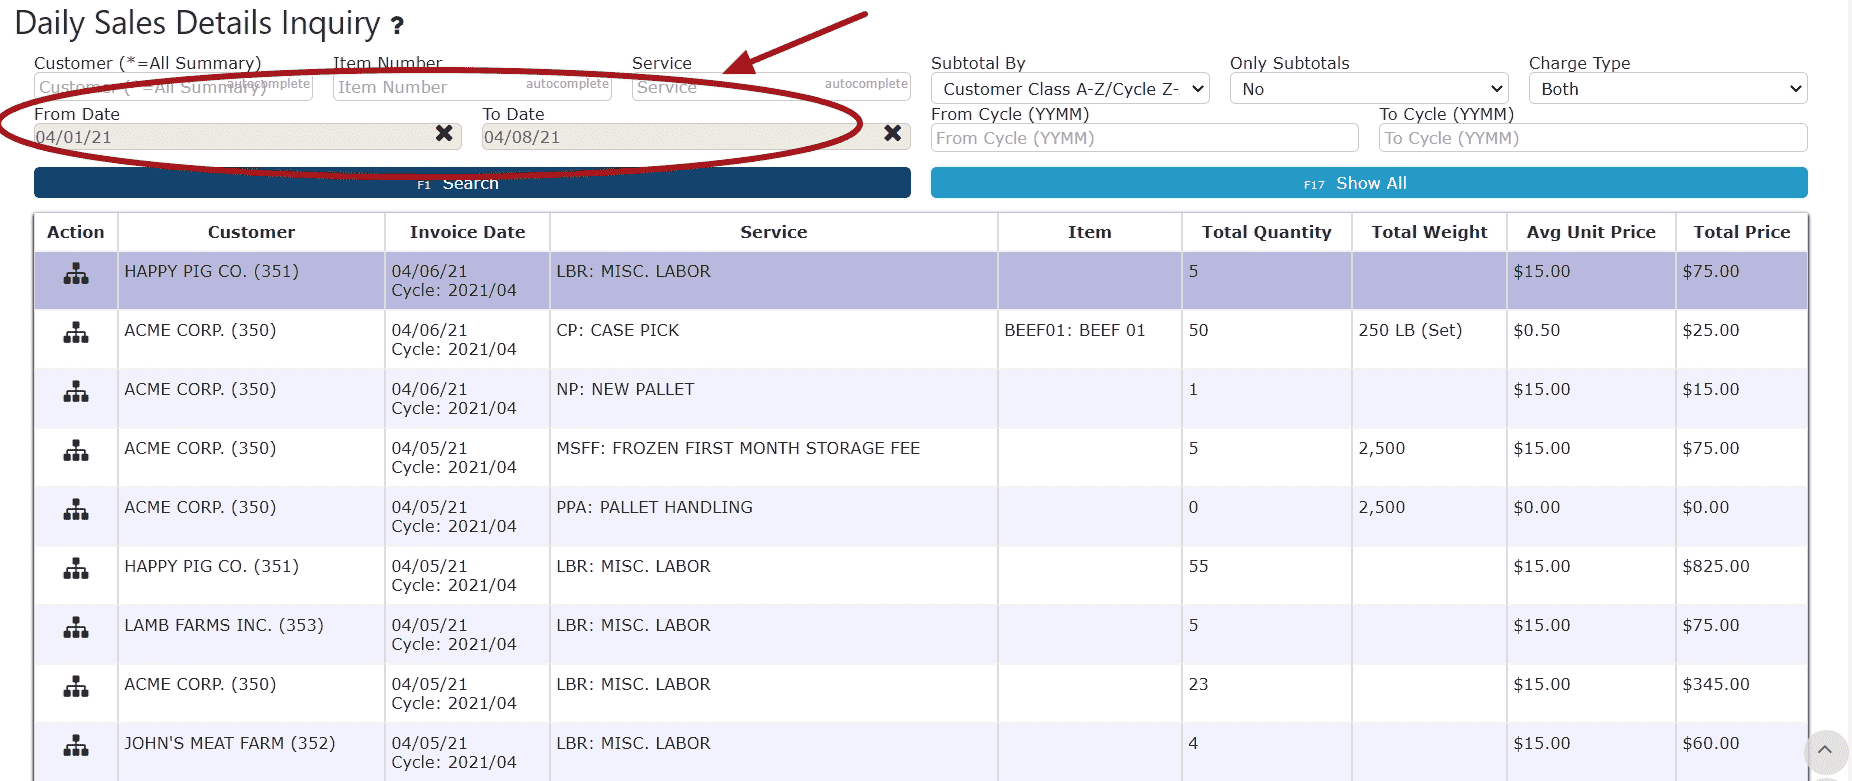
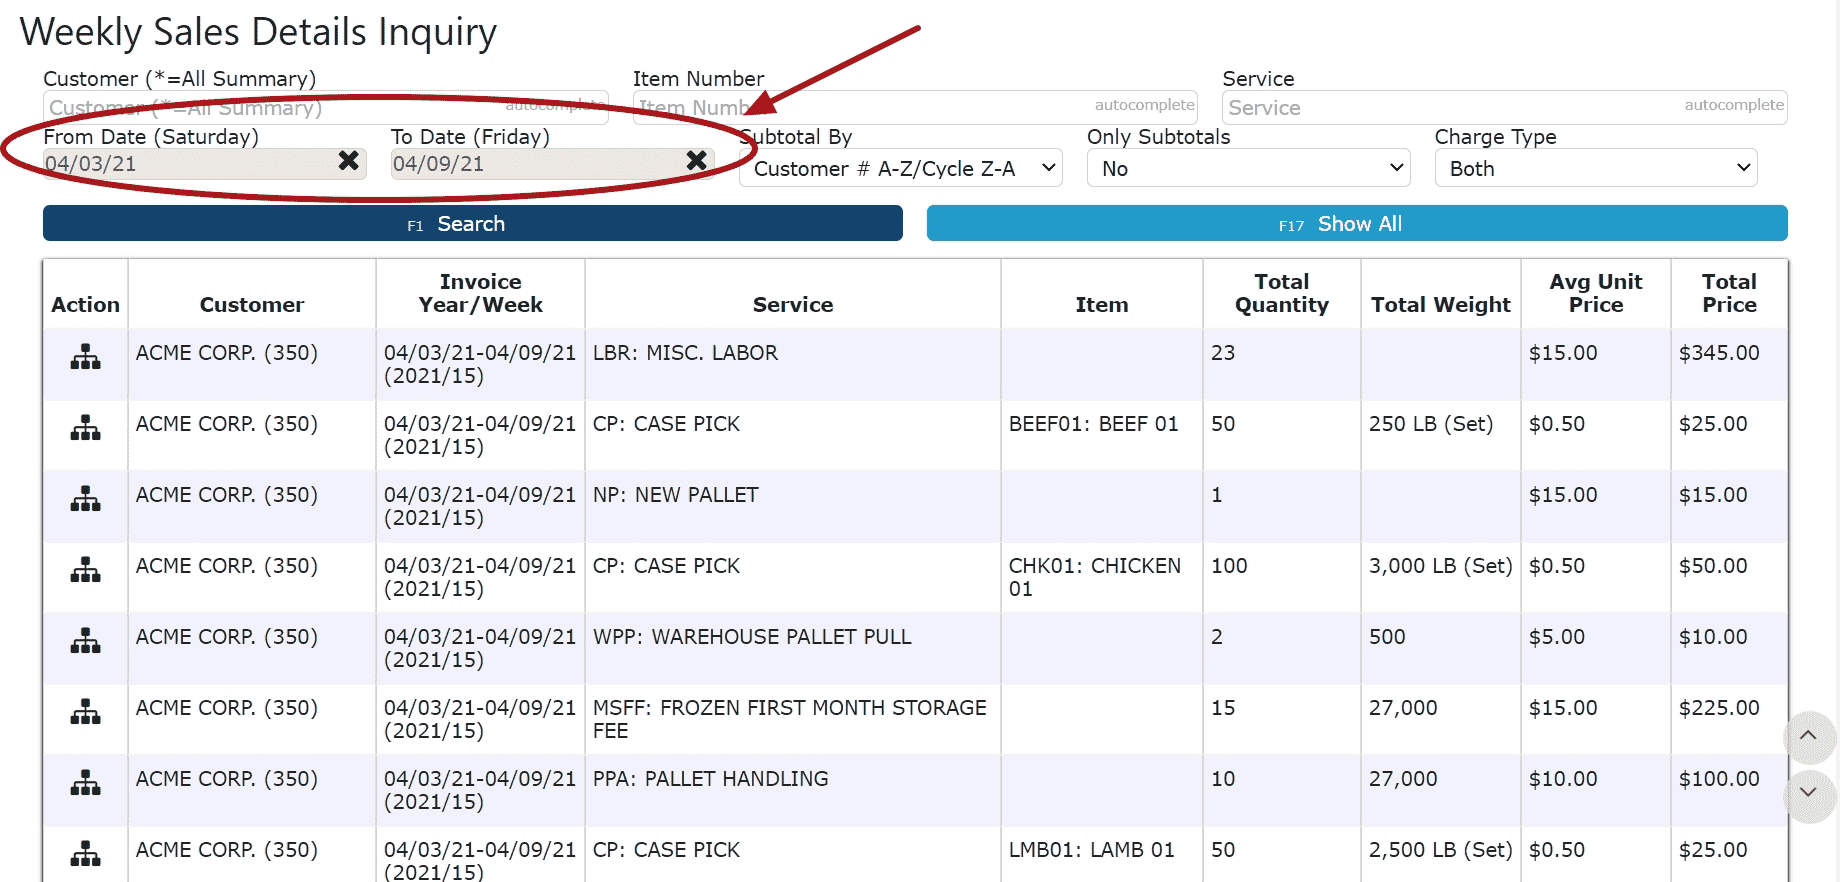
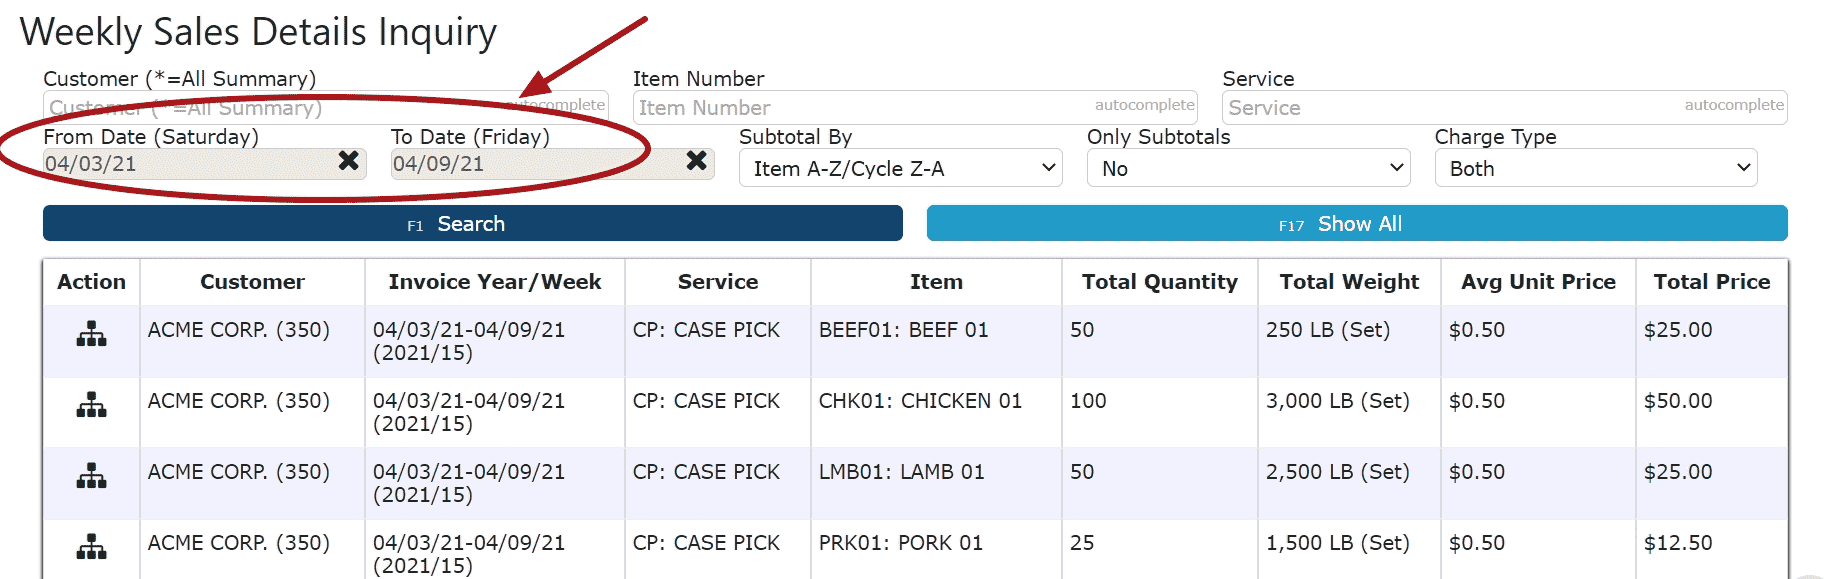
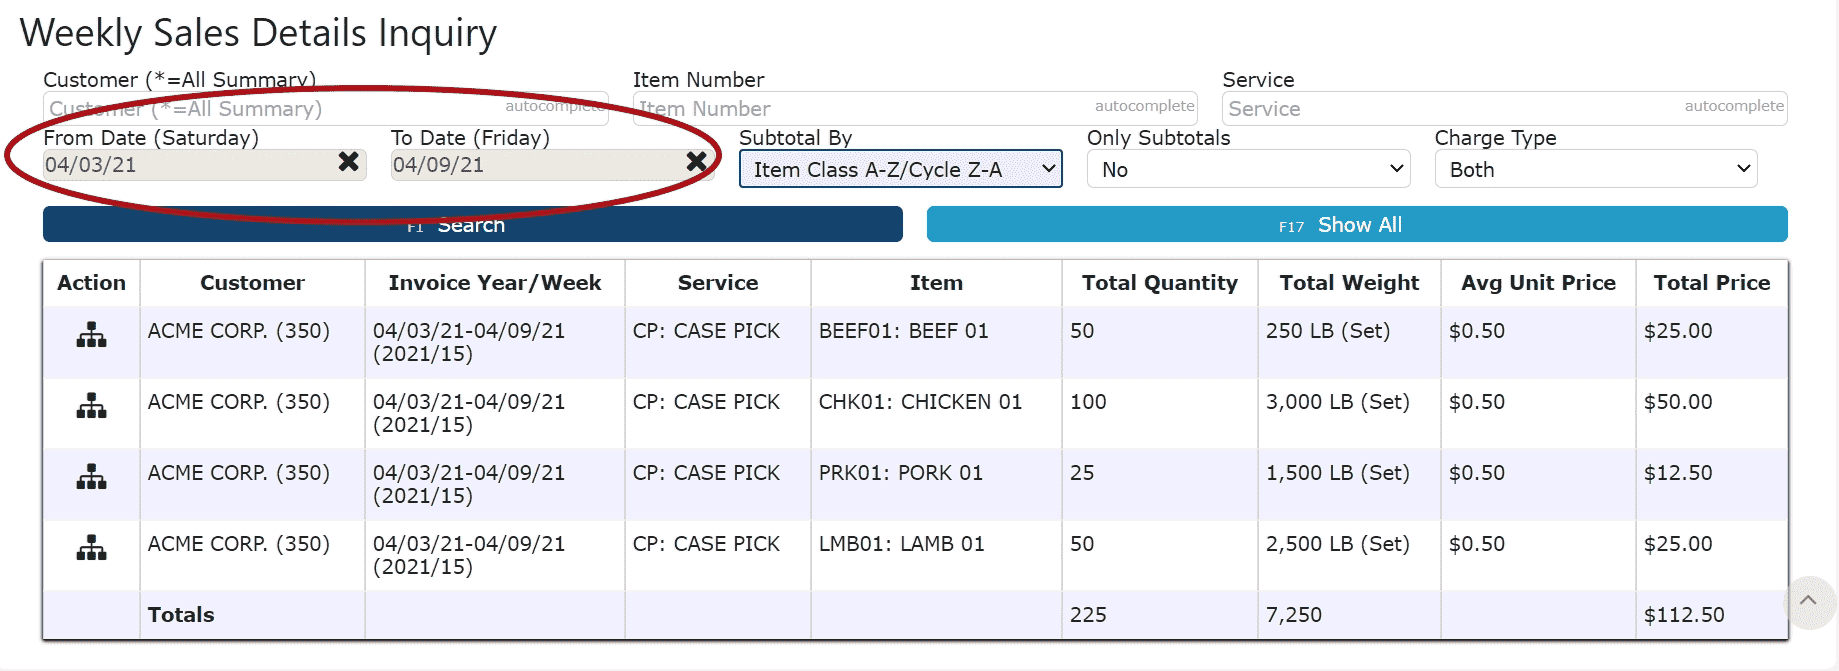
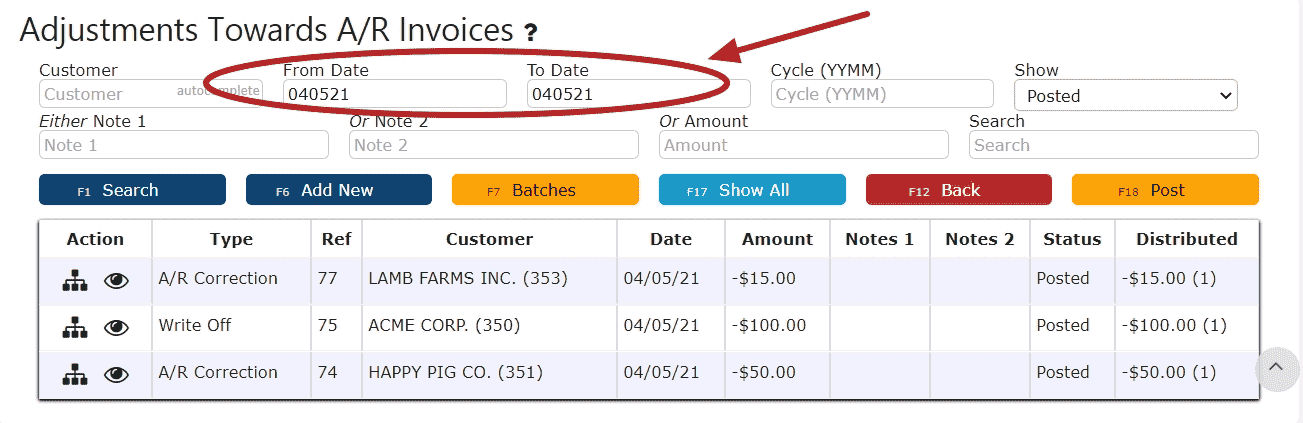
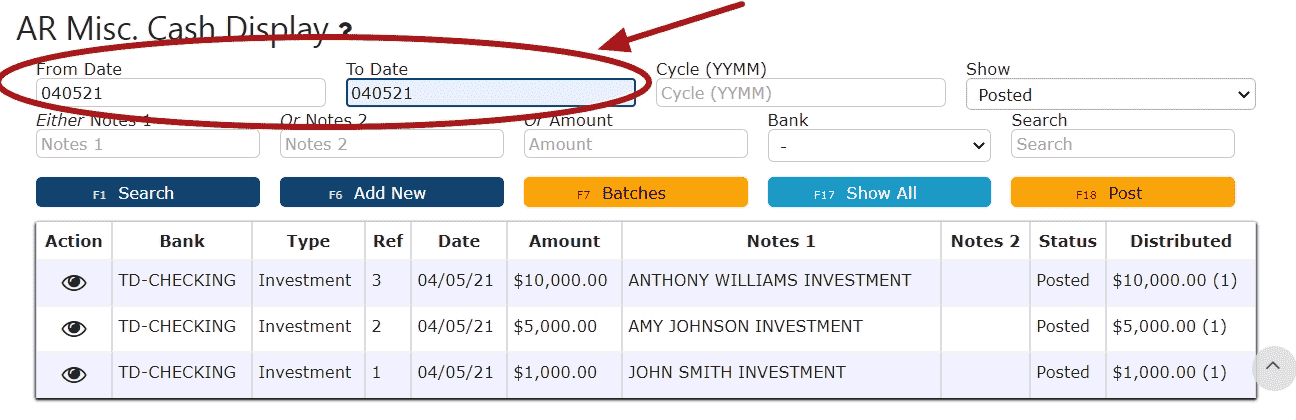
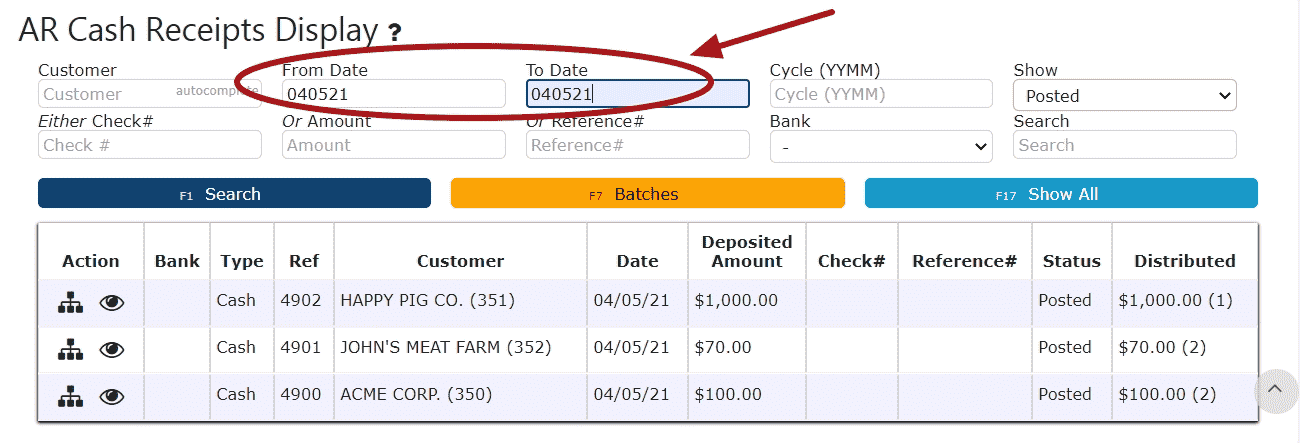
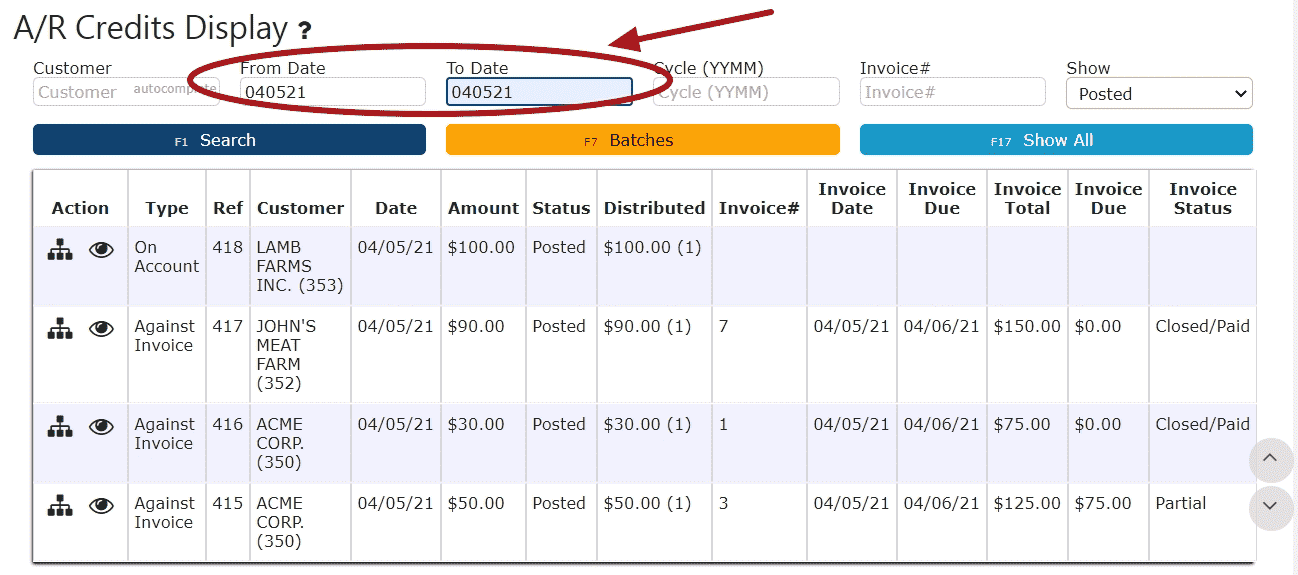
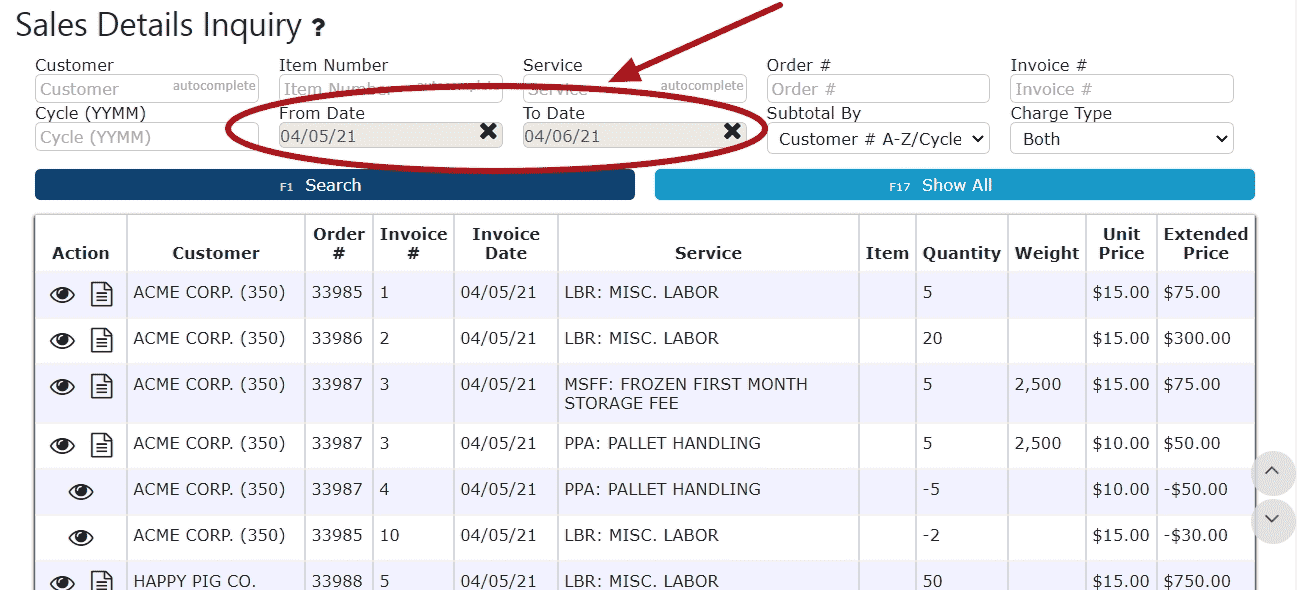
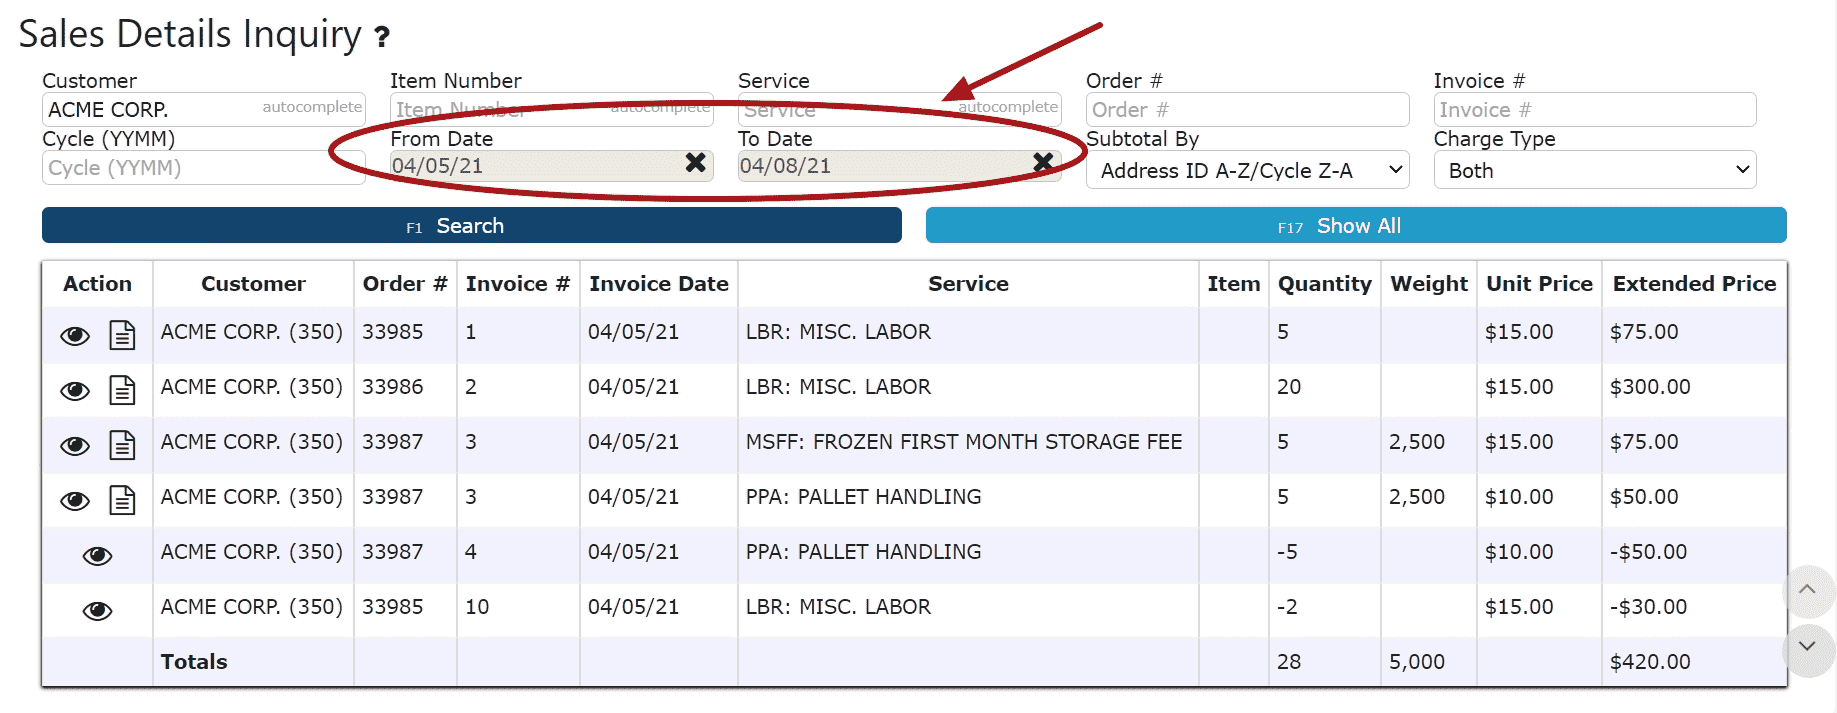
To Limit by Date:
1. Enter either a From Date, To Date or both a From and To Date and click the Search Button
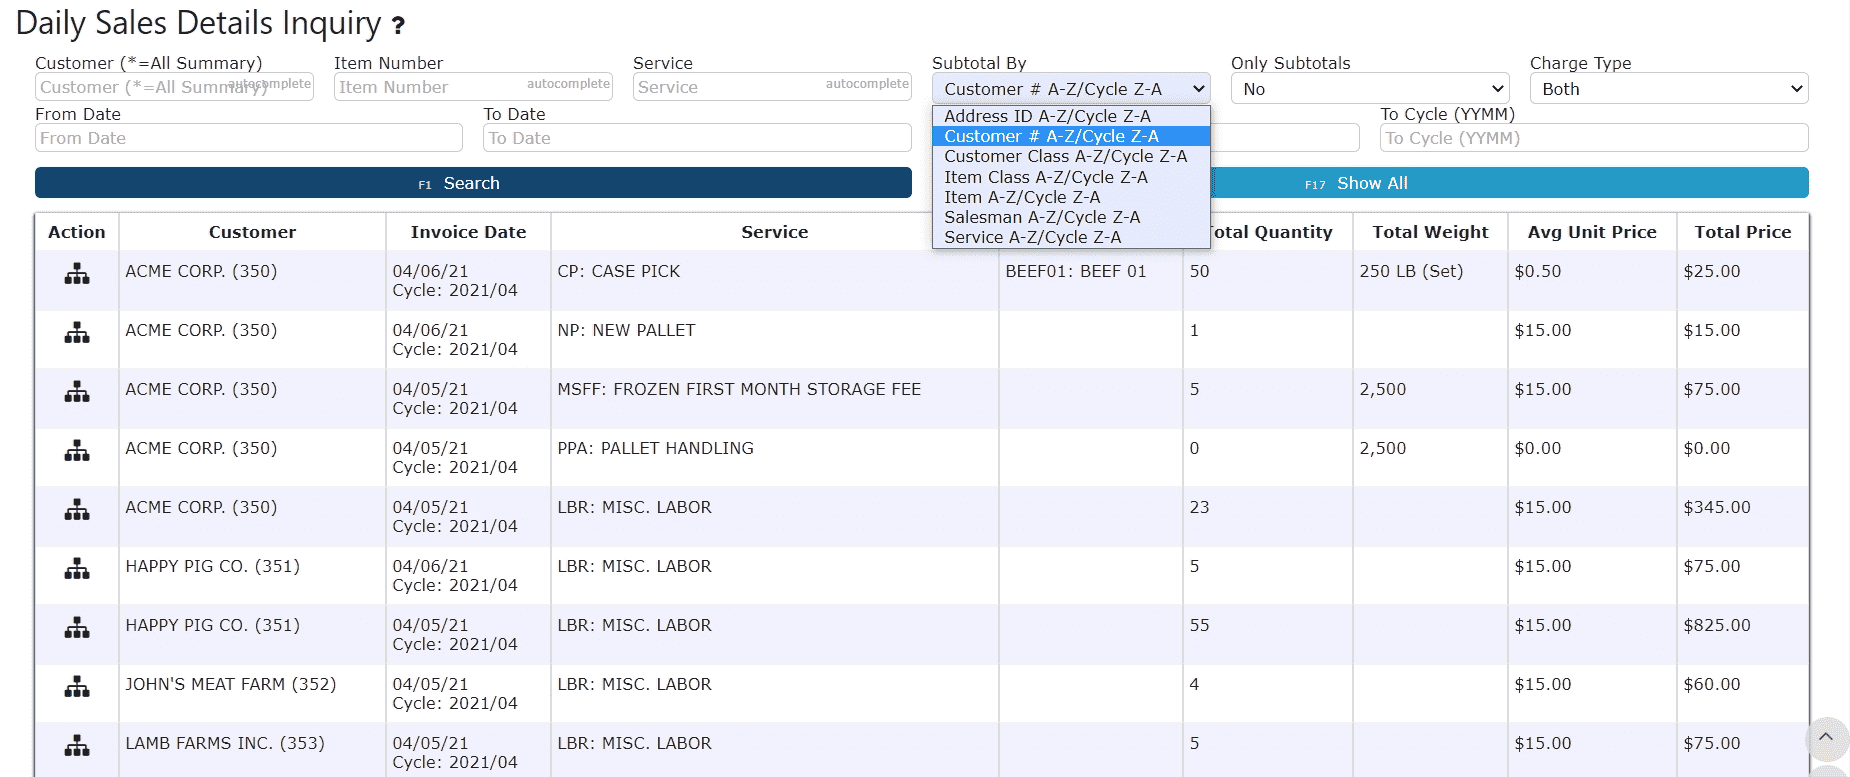
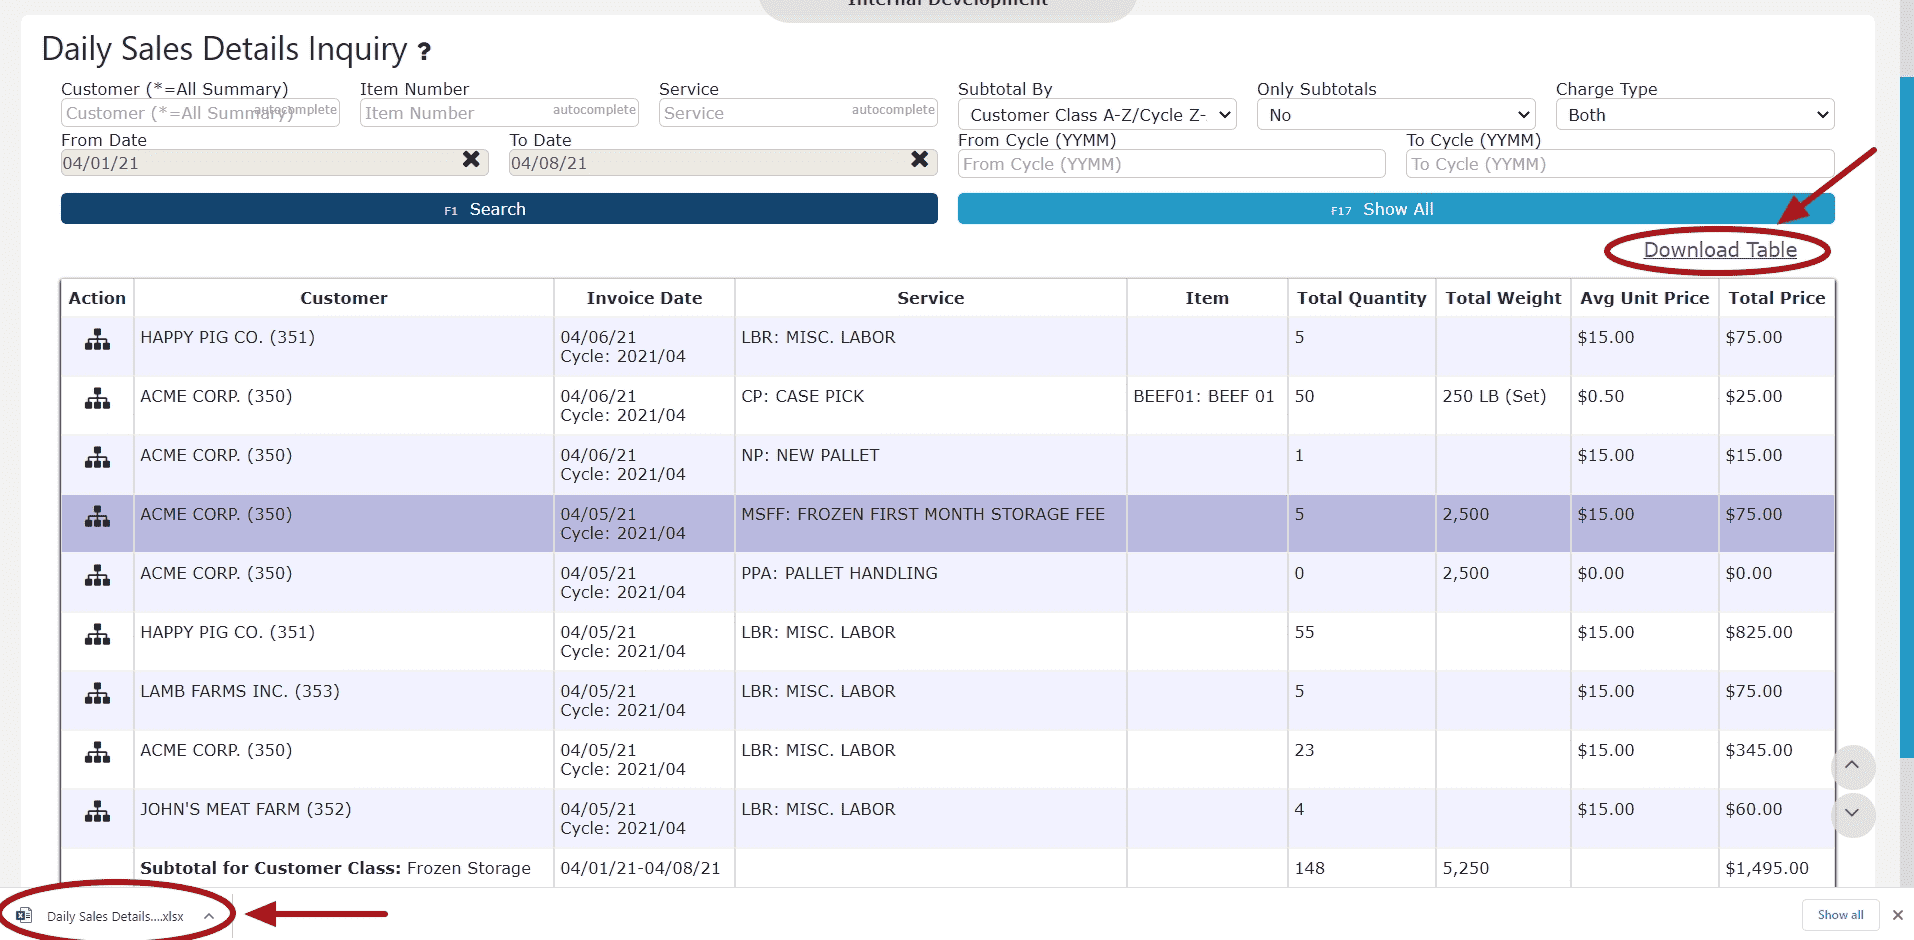
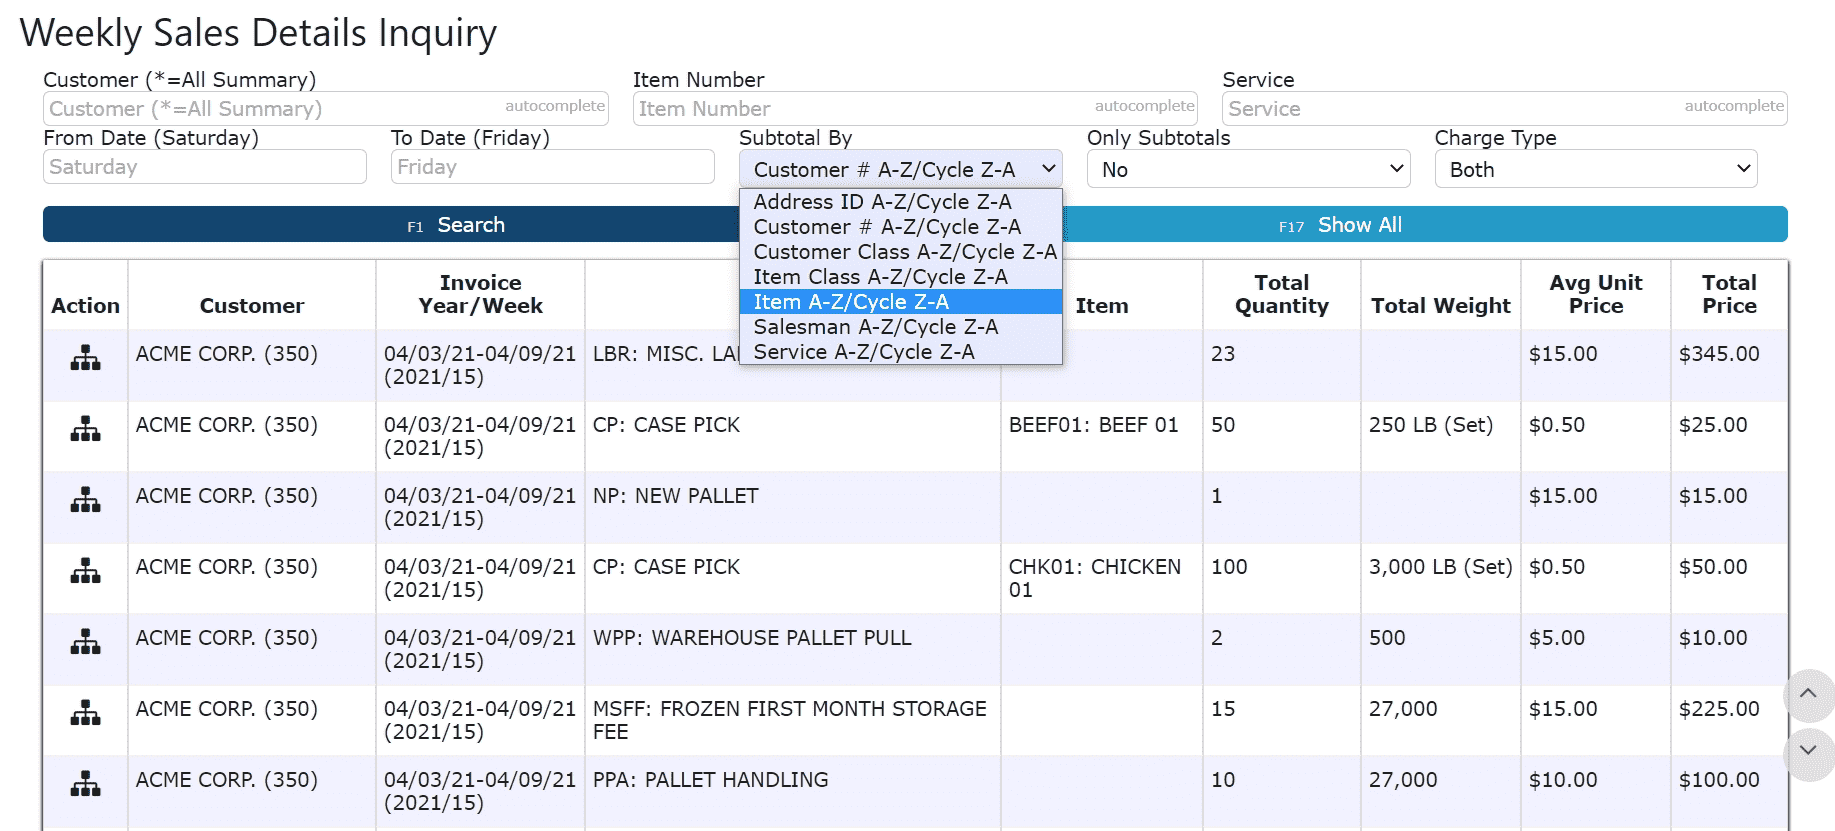
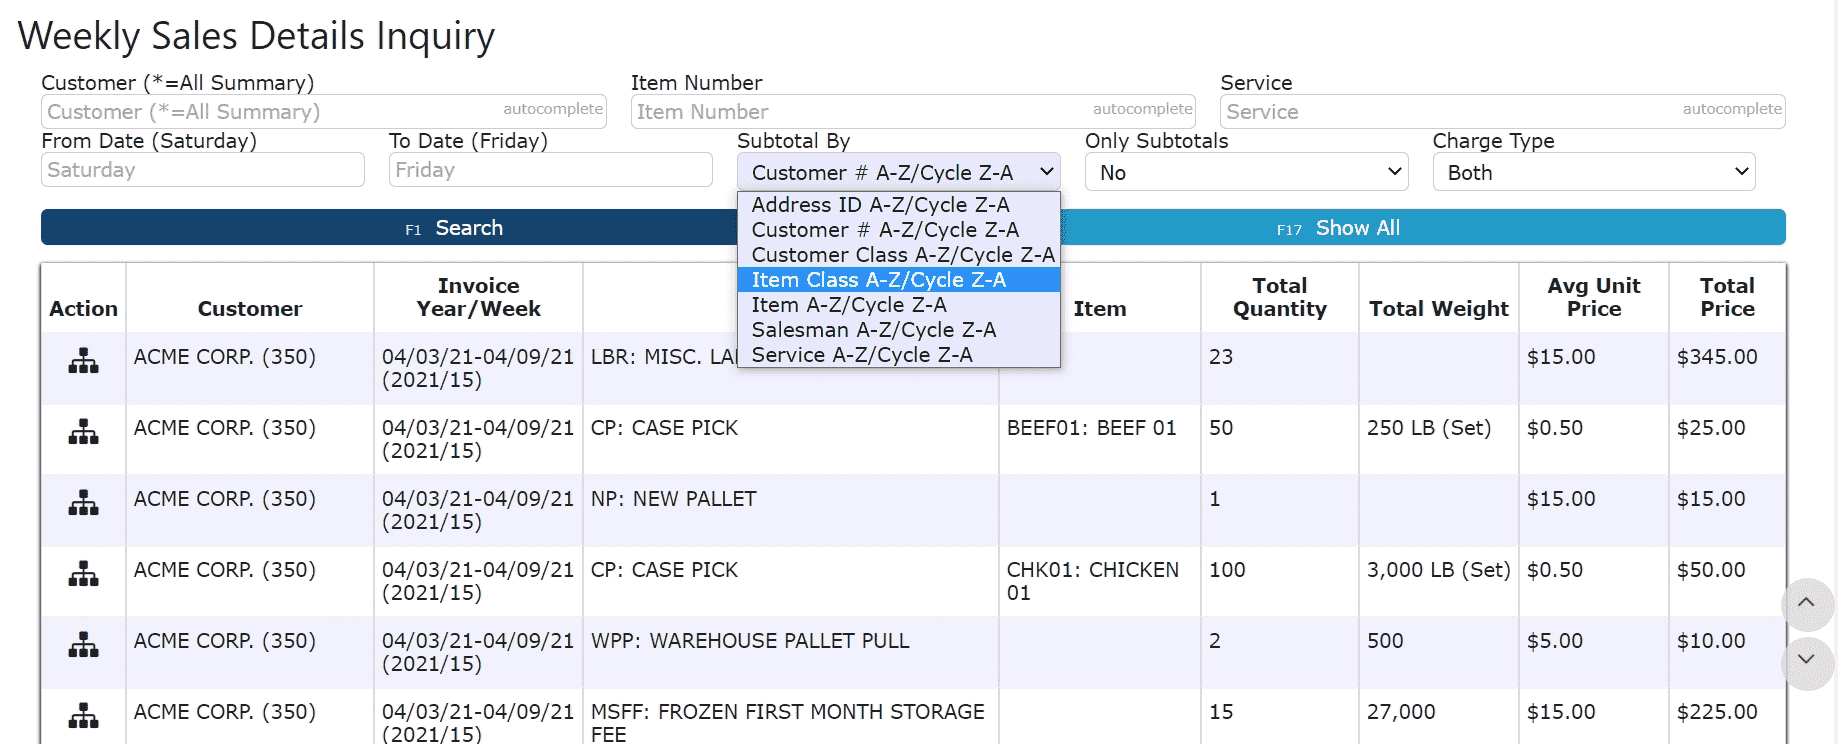
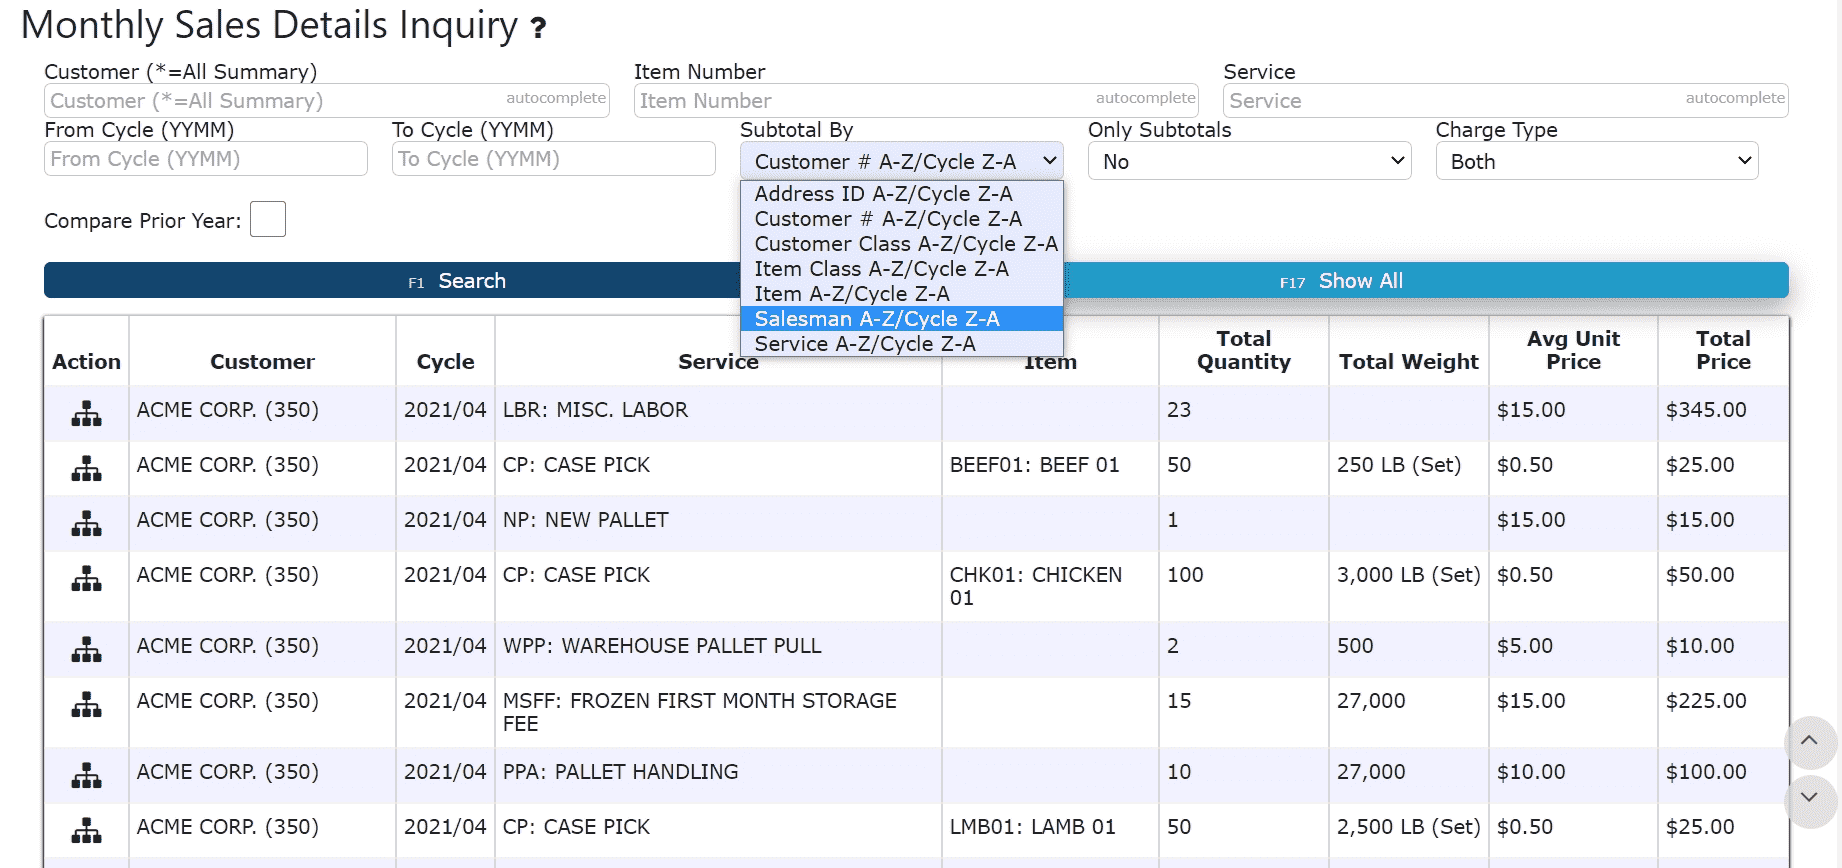
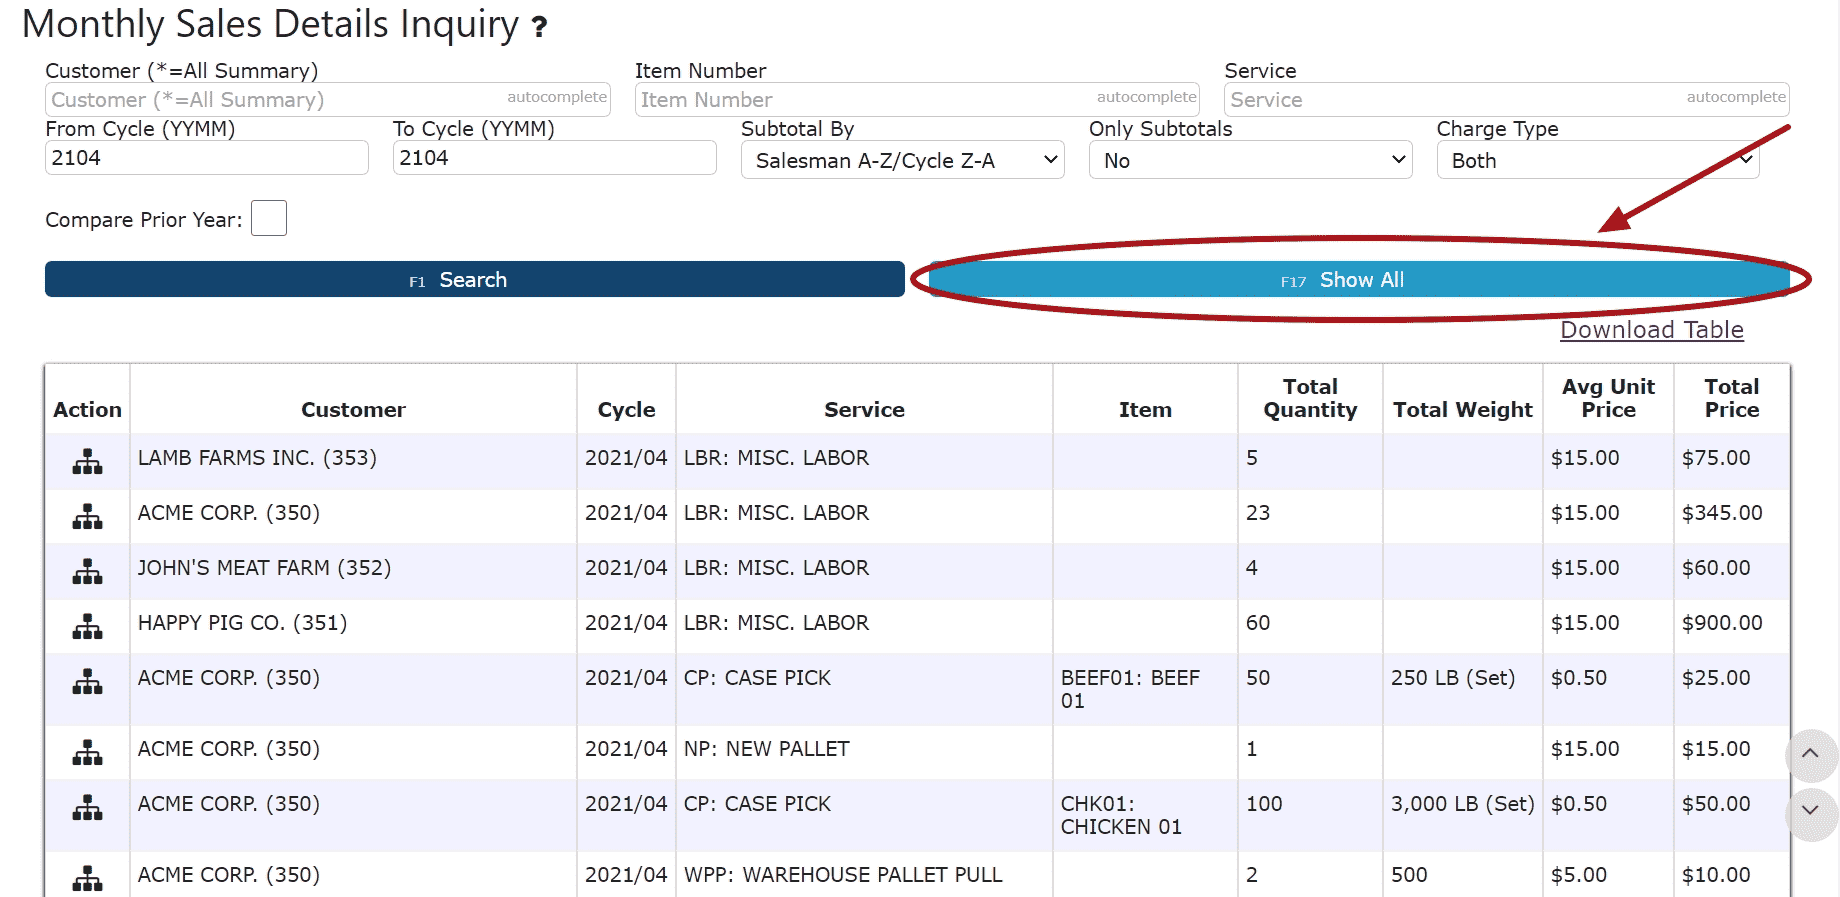
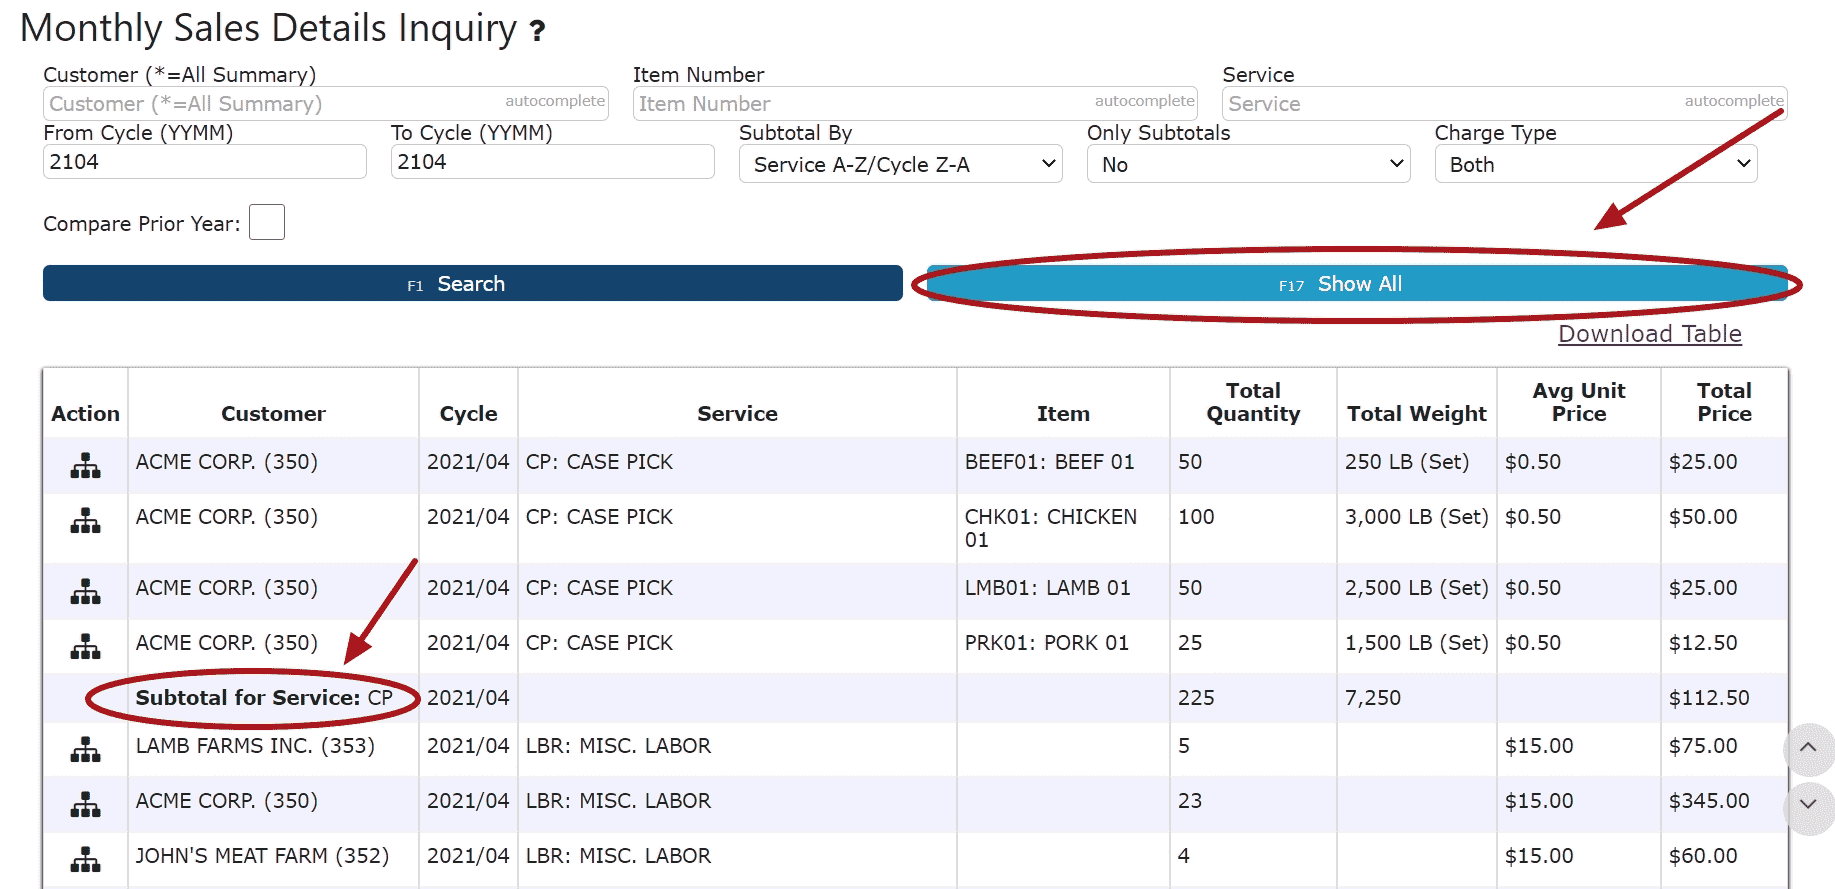
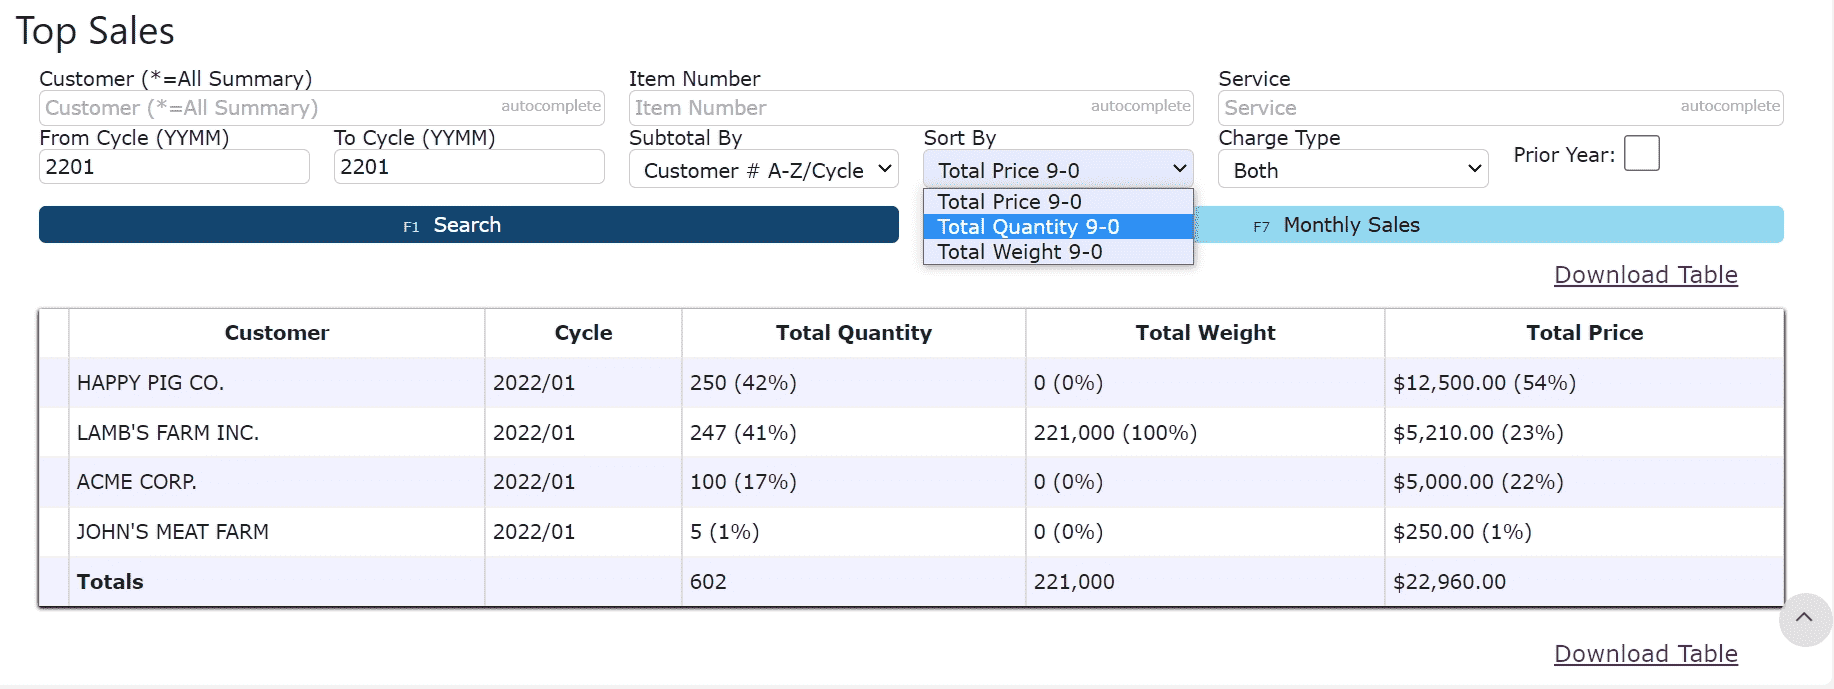
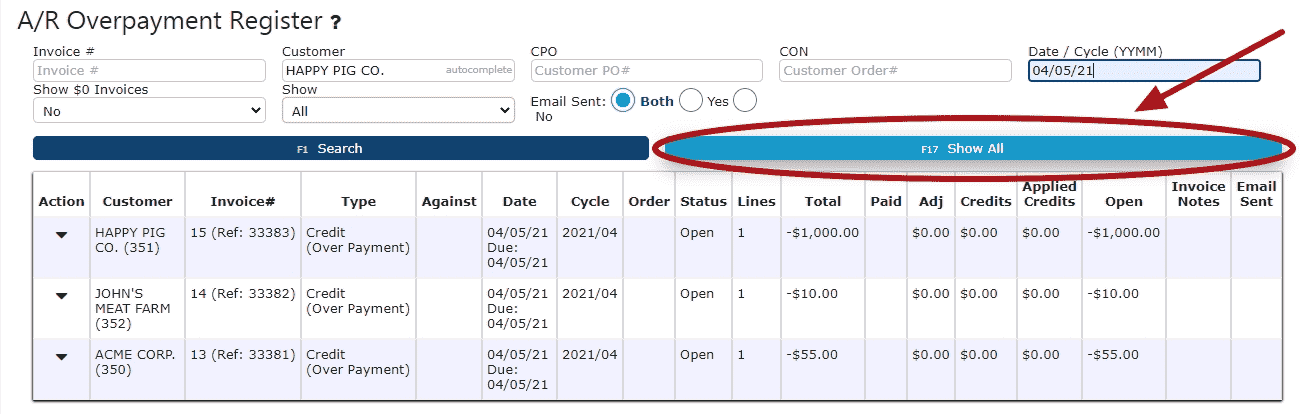
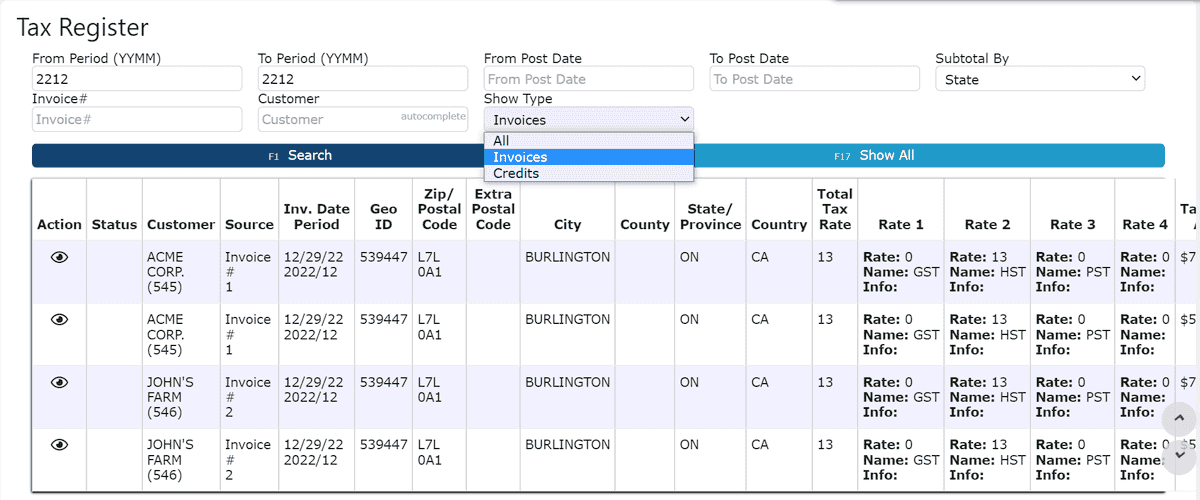
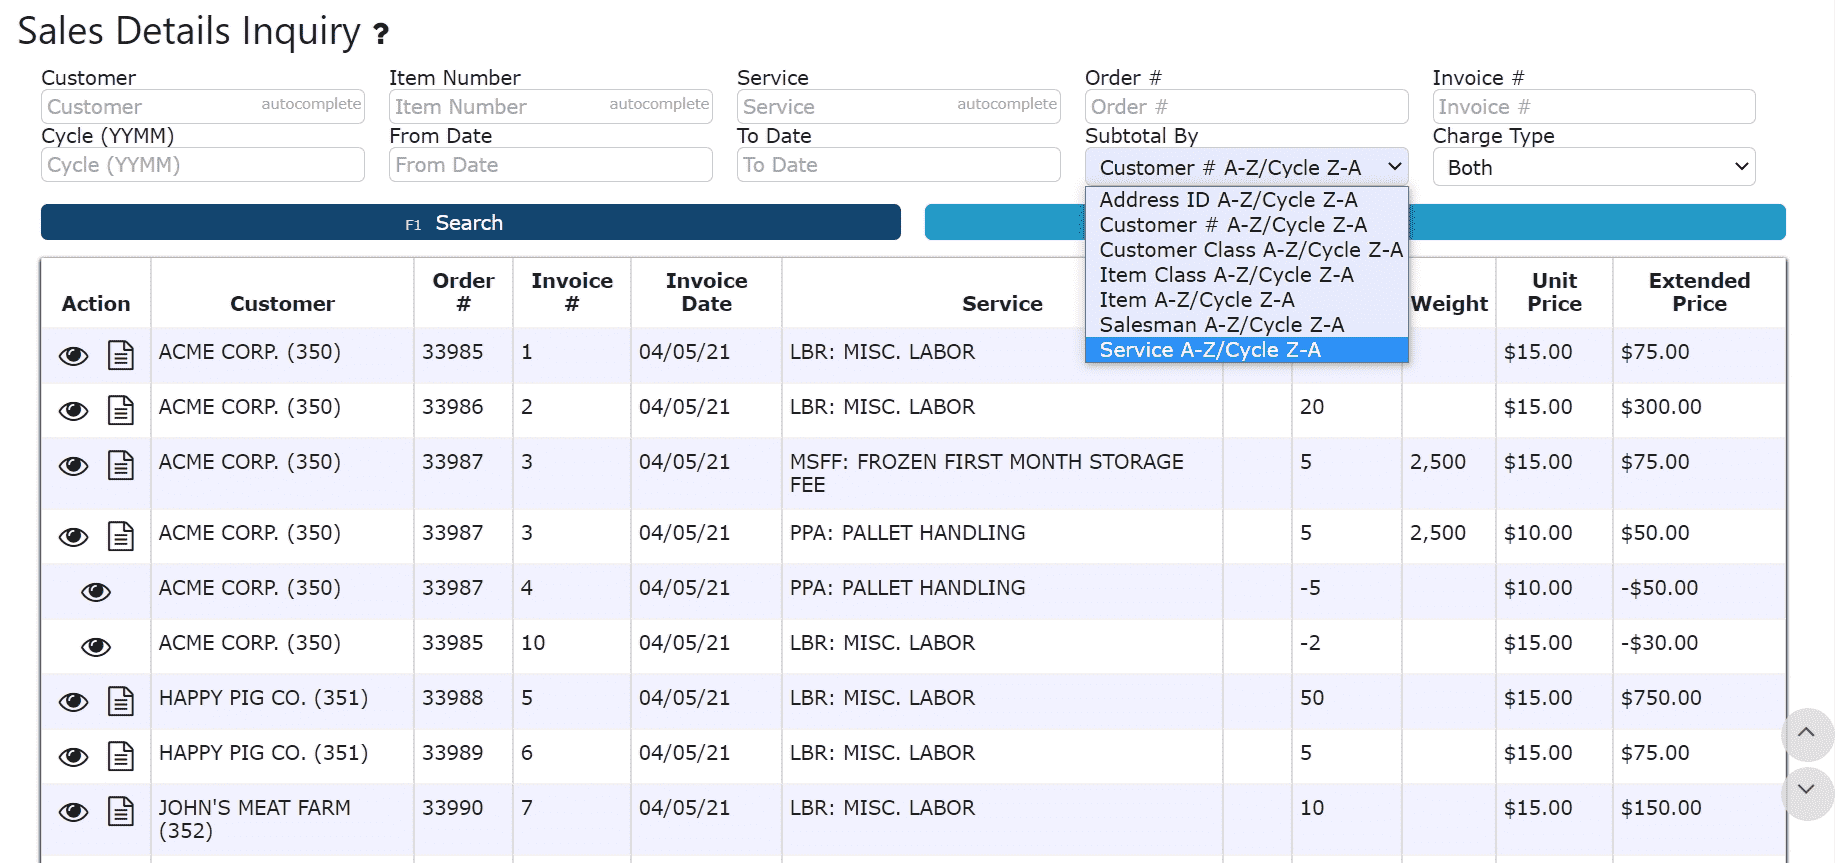
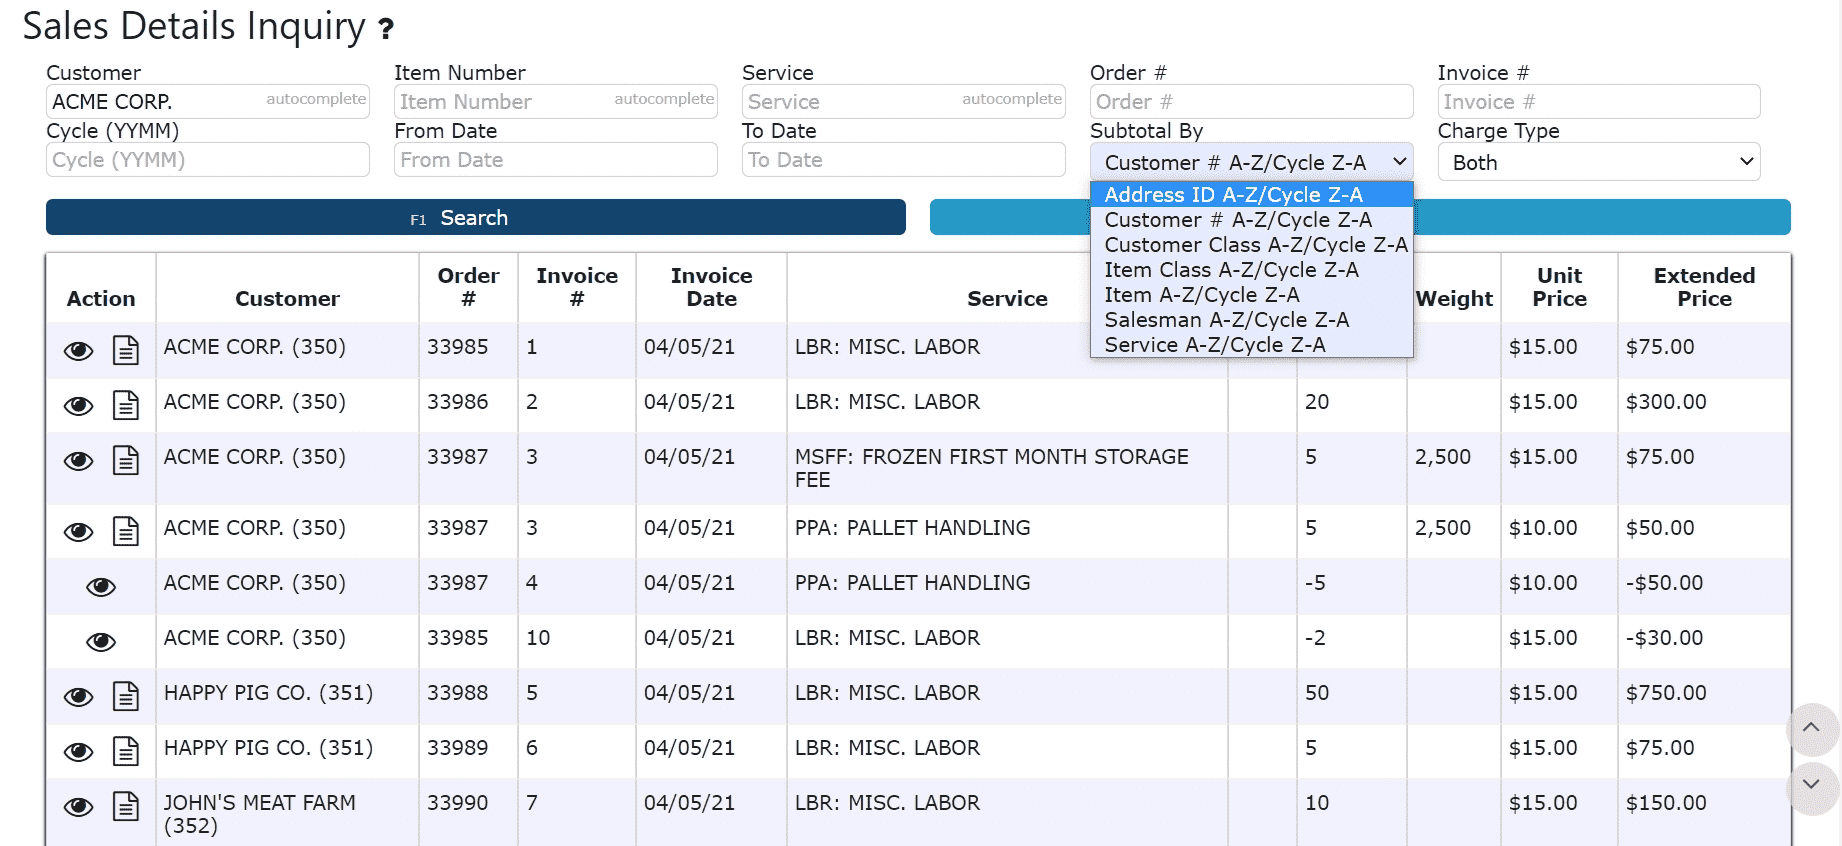
To Generate Subtotals:
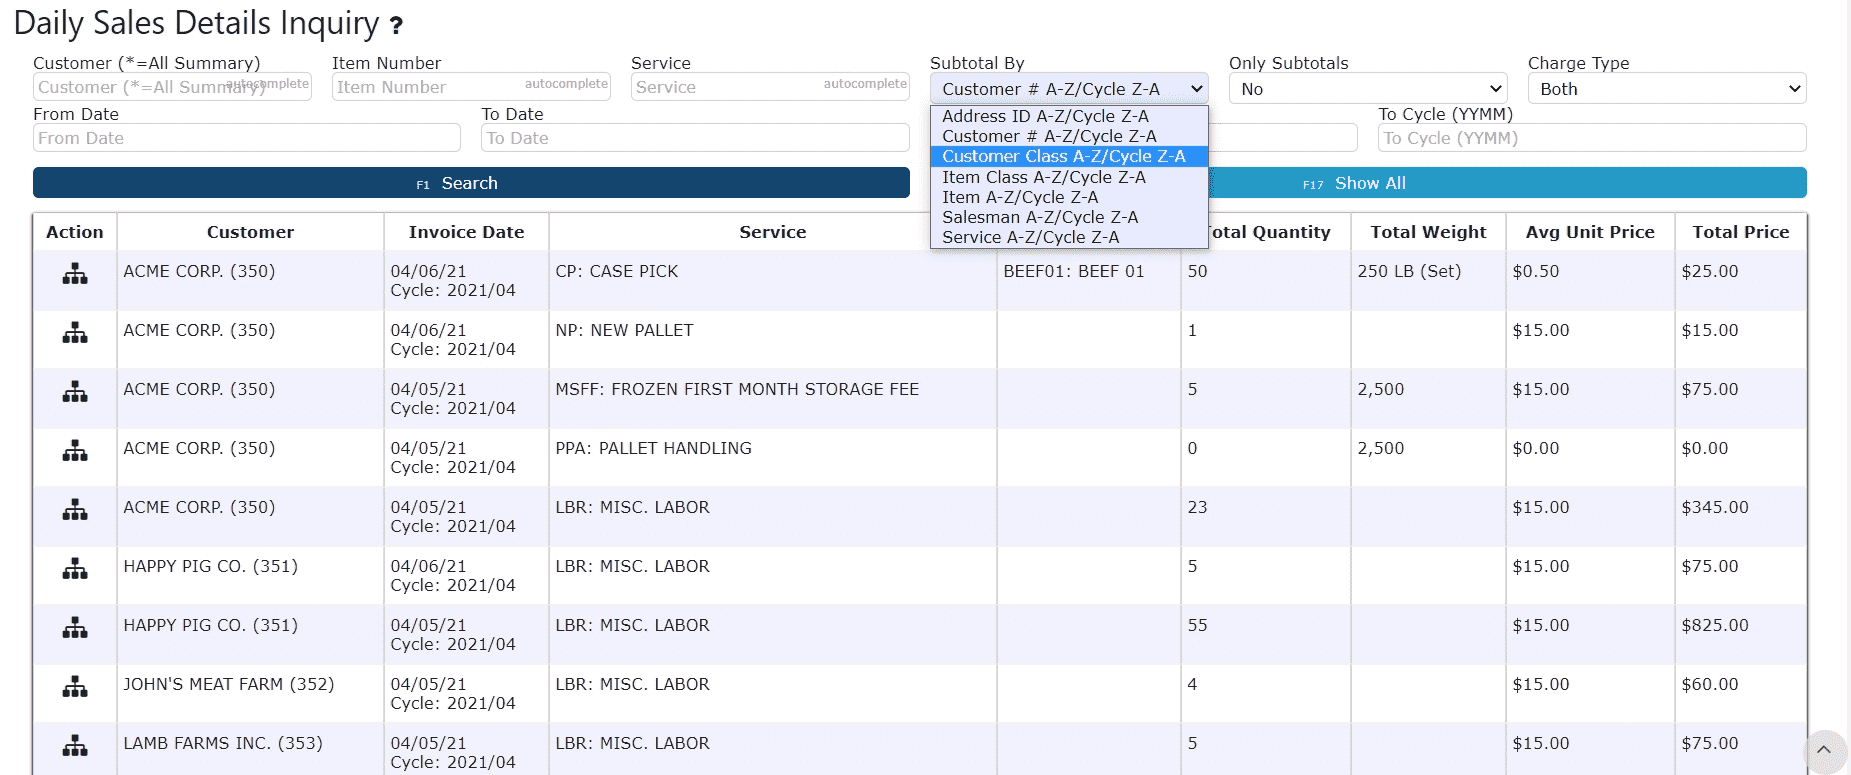
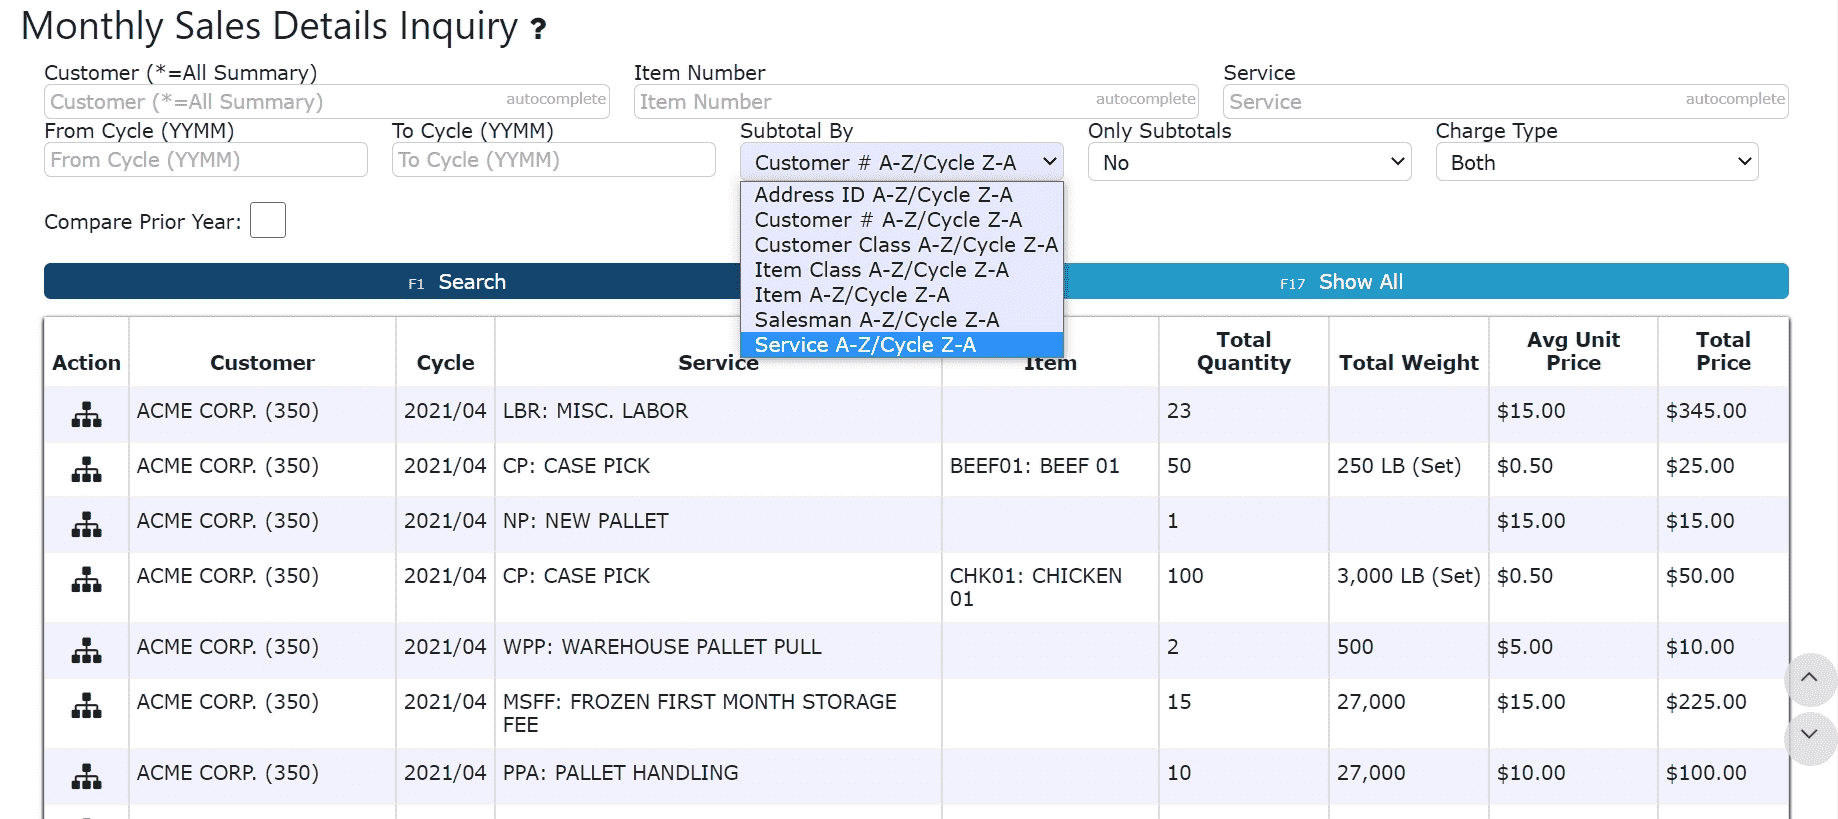
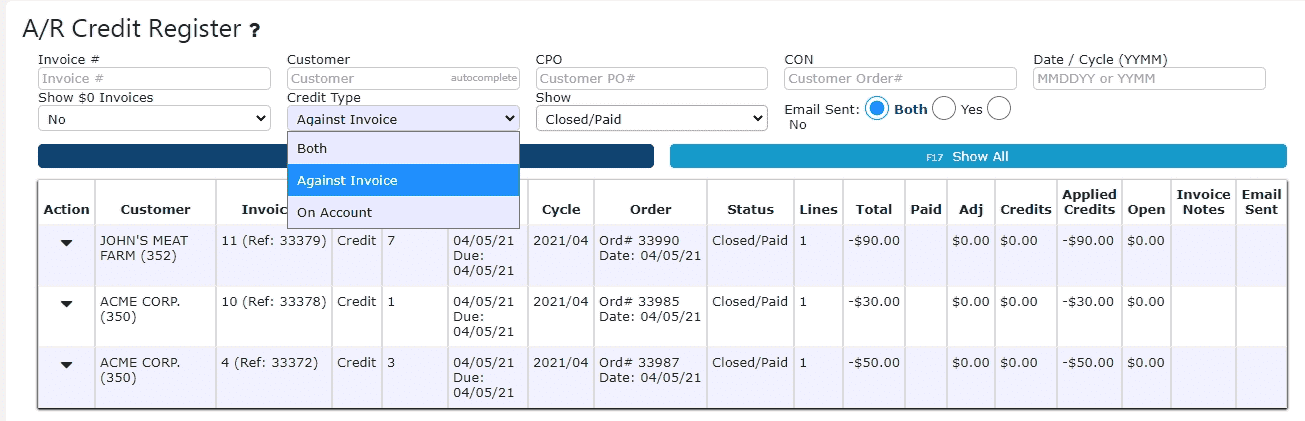
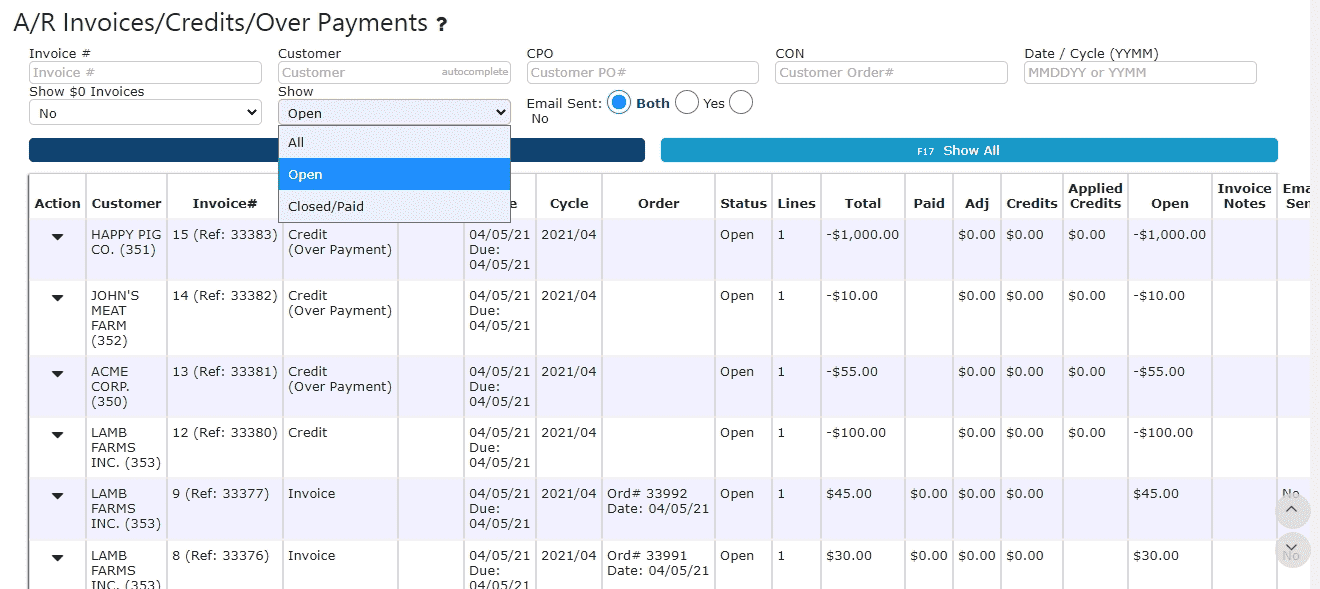
Example 1: Subtotal by Service1. Select the appropriate option from the Subtotal By Drop Down
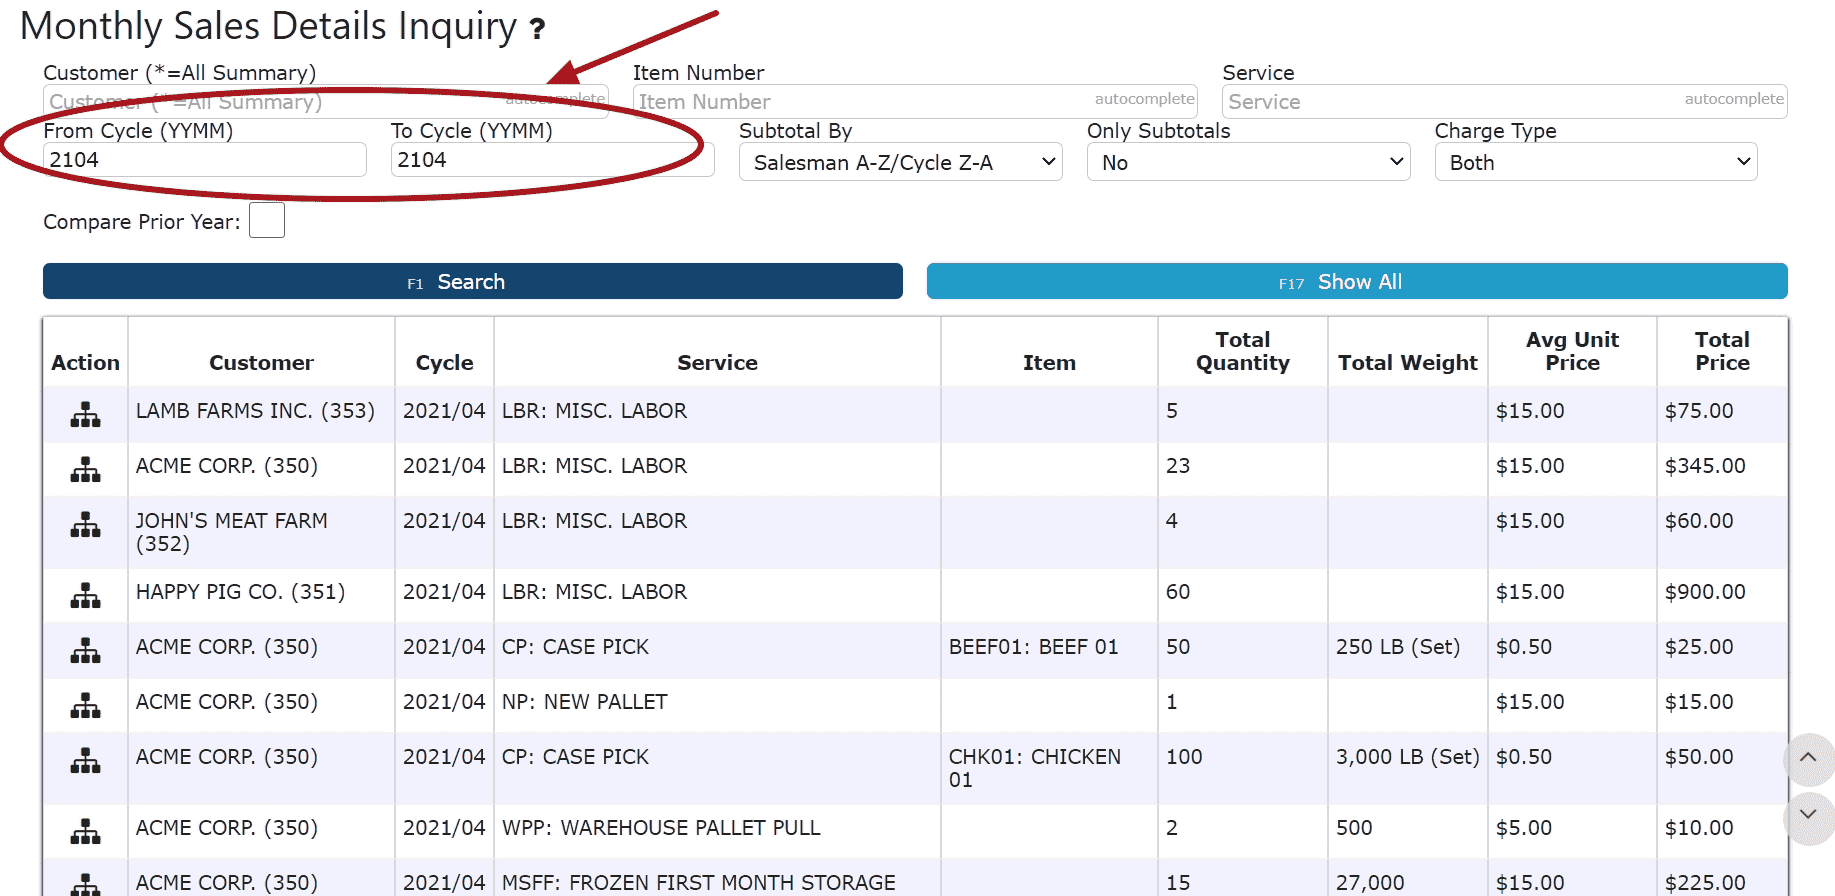
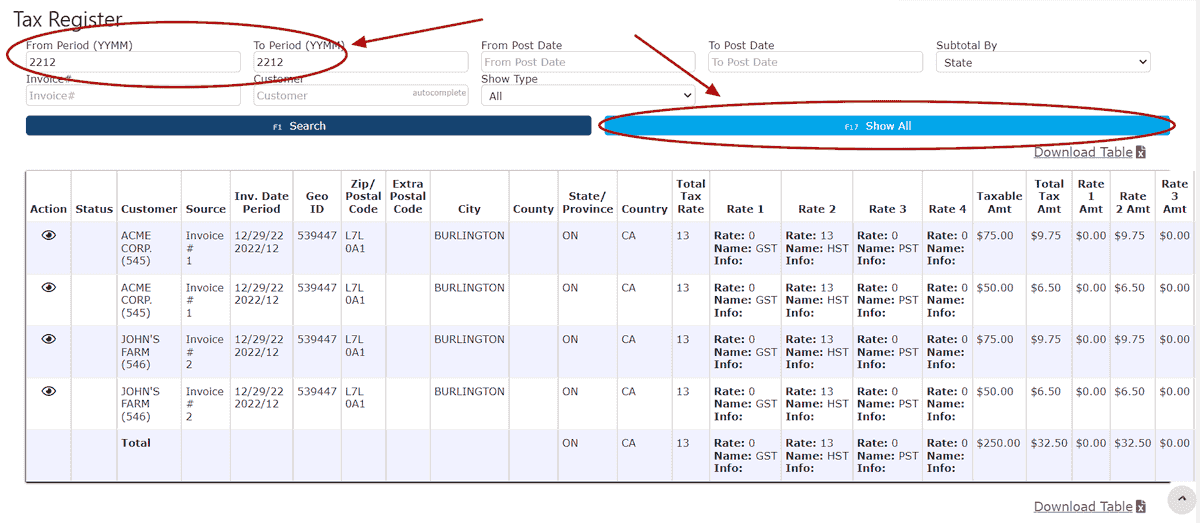
2. Enter either a Cycle or a From/To Date (Required)
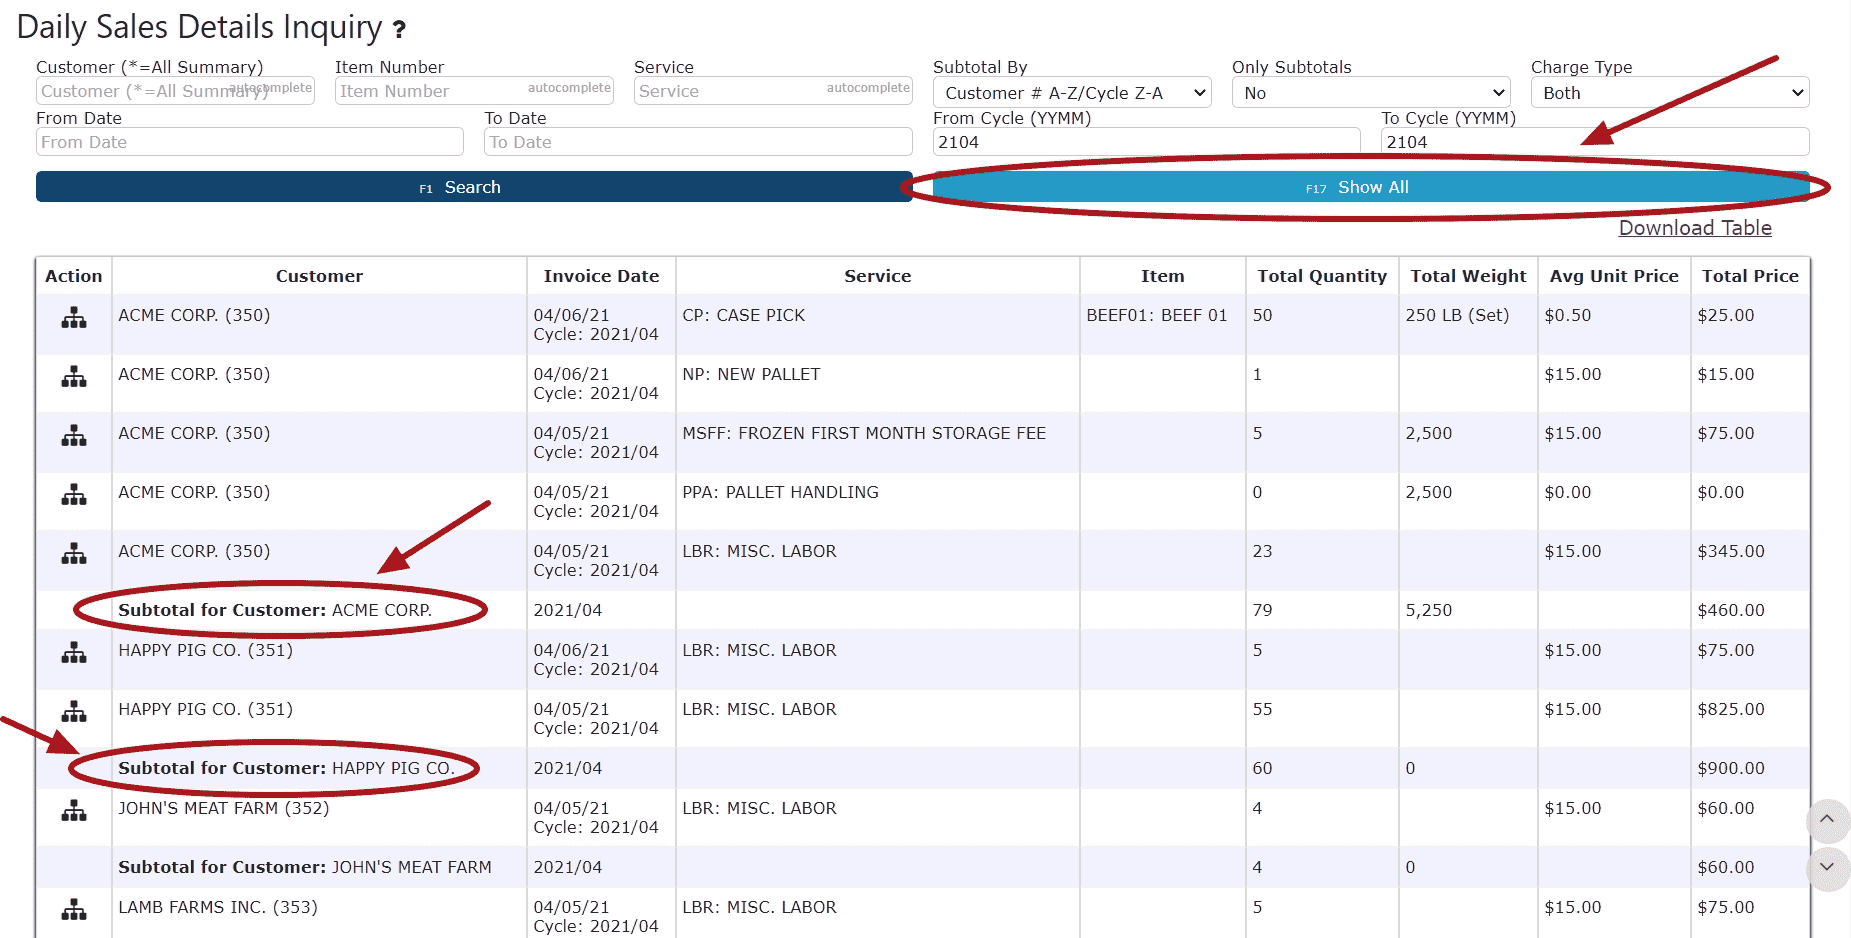
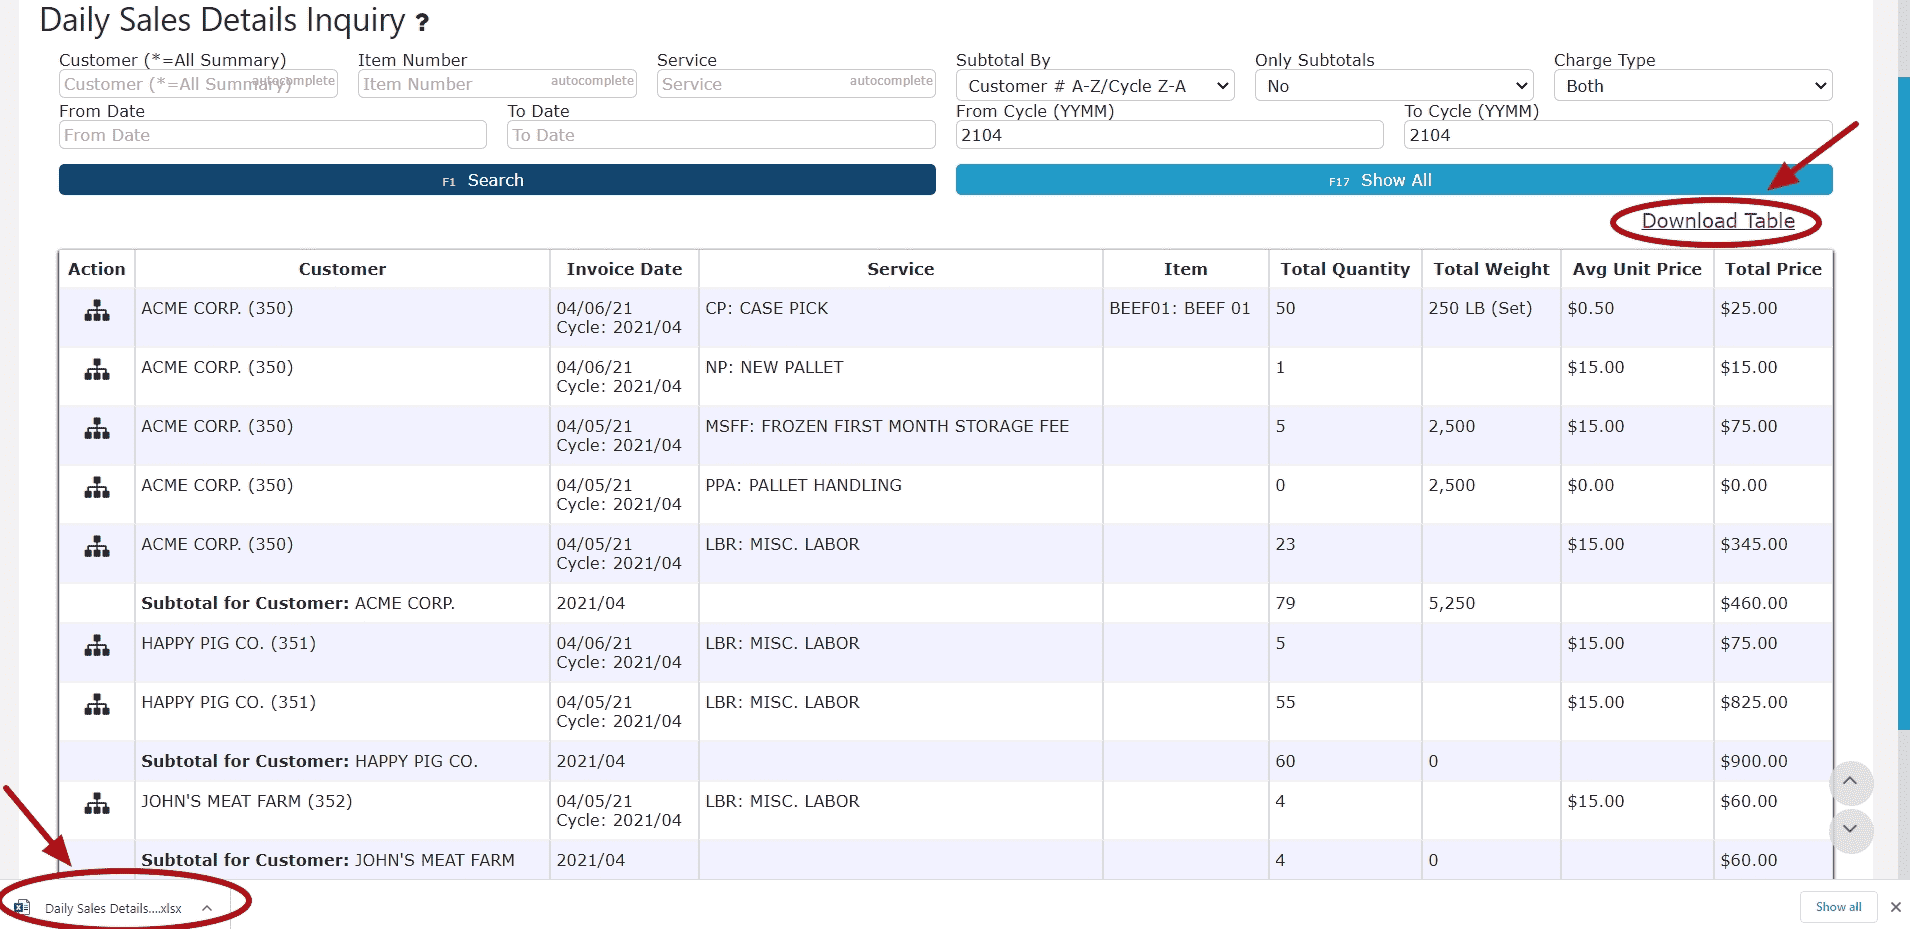
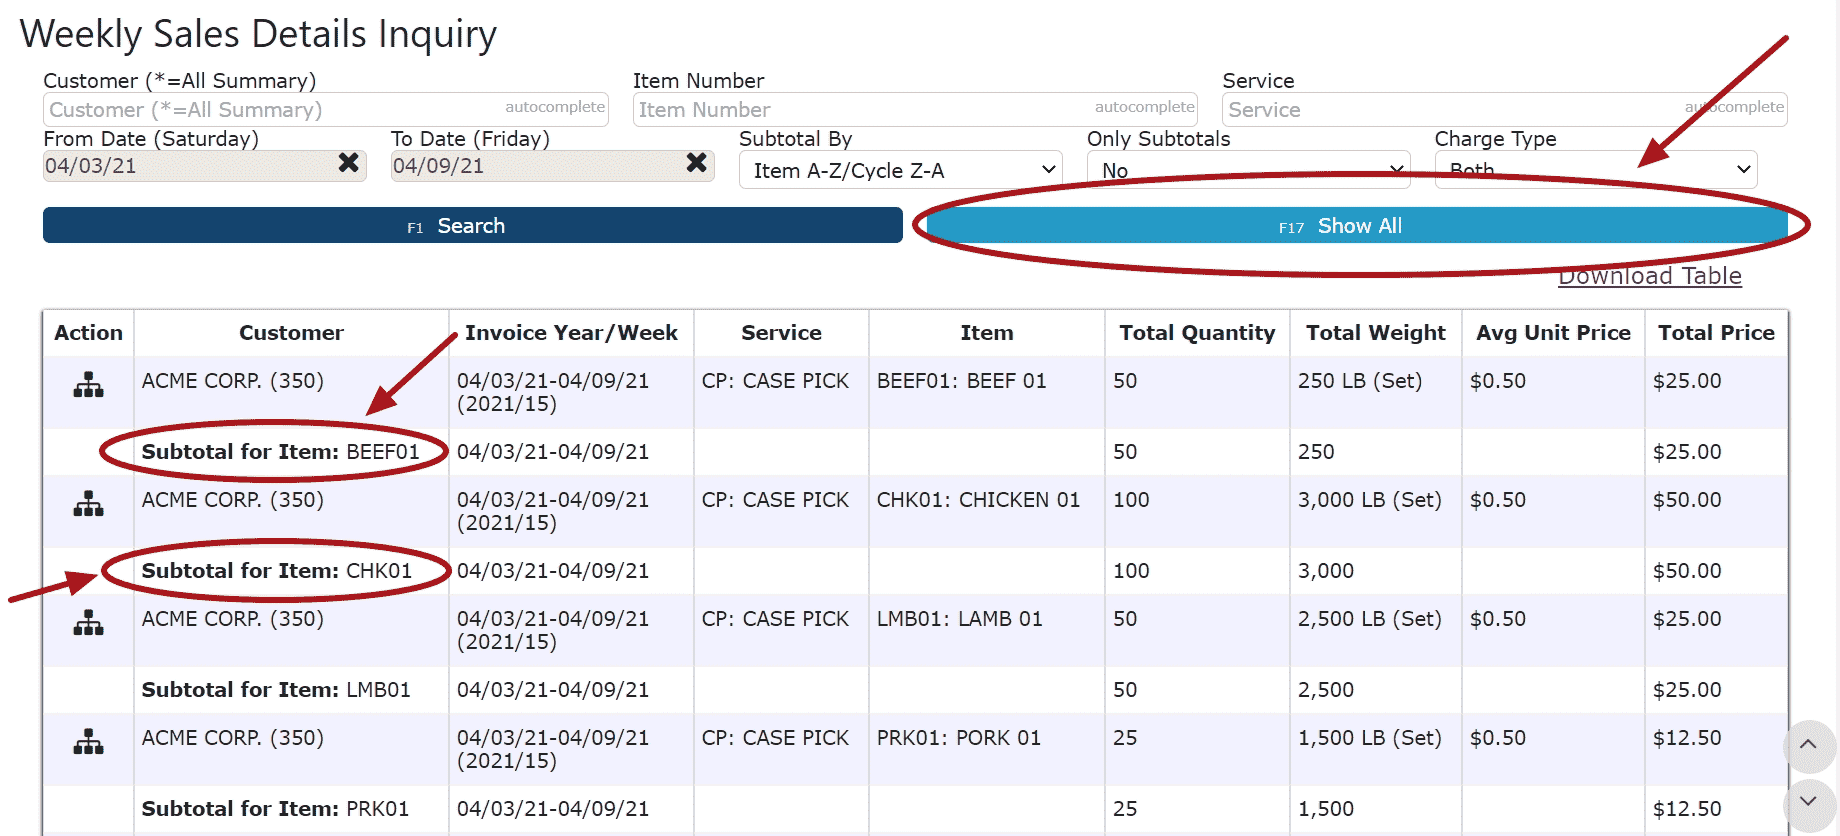
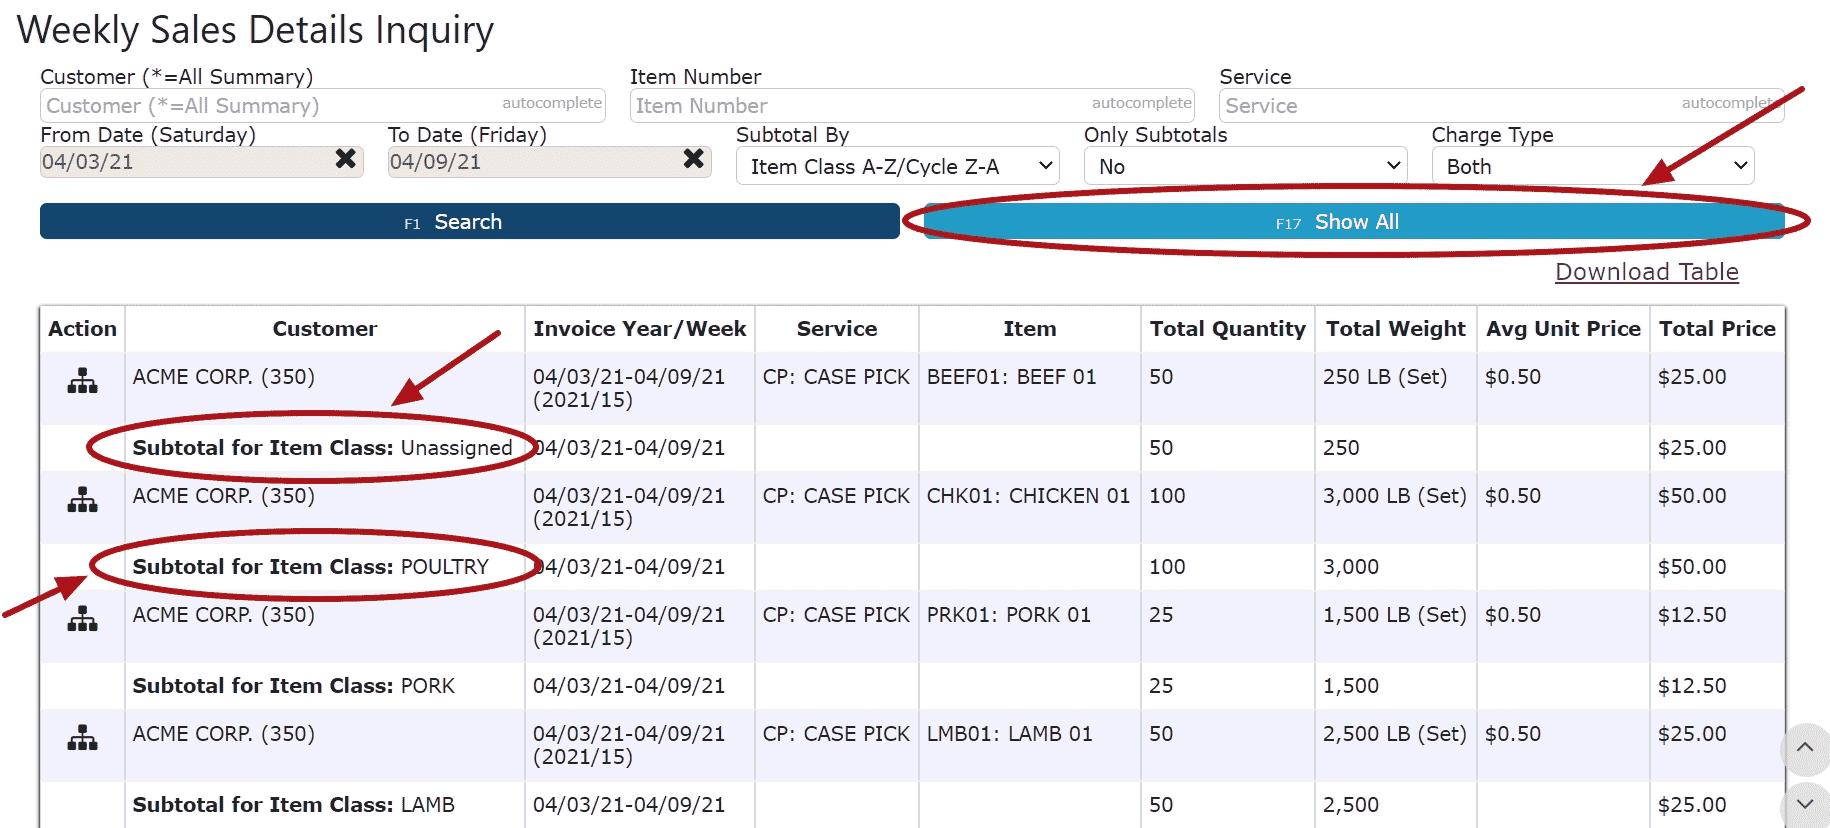
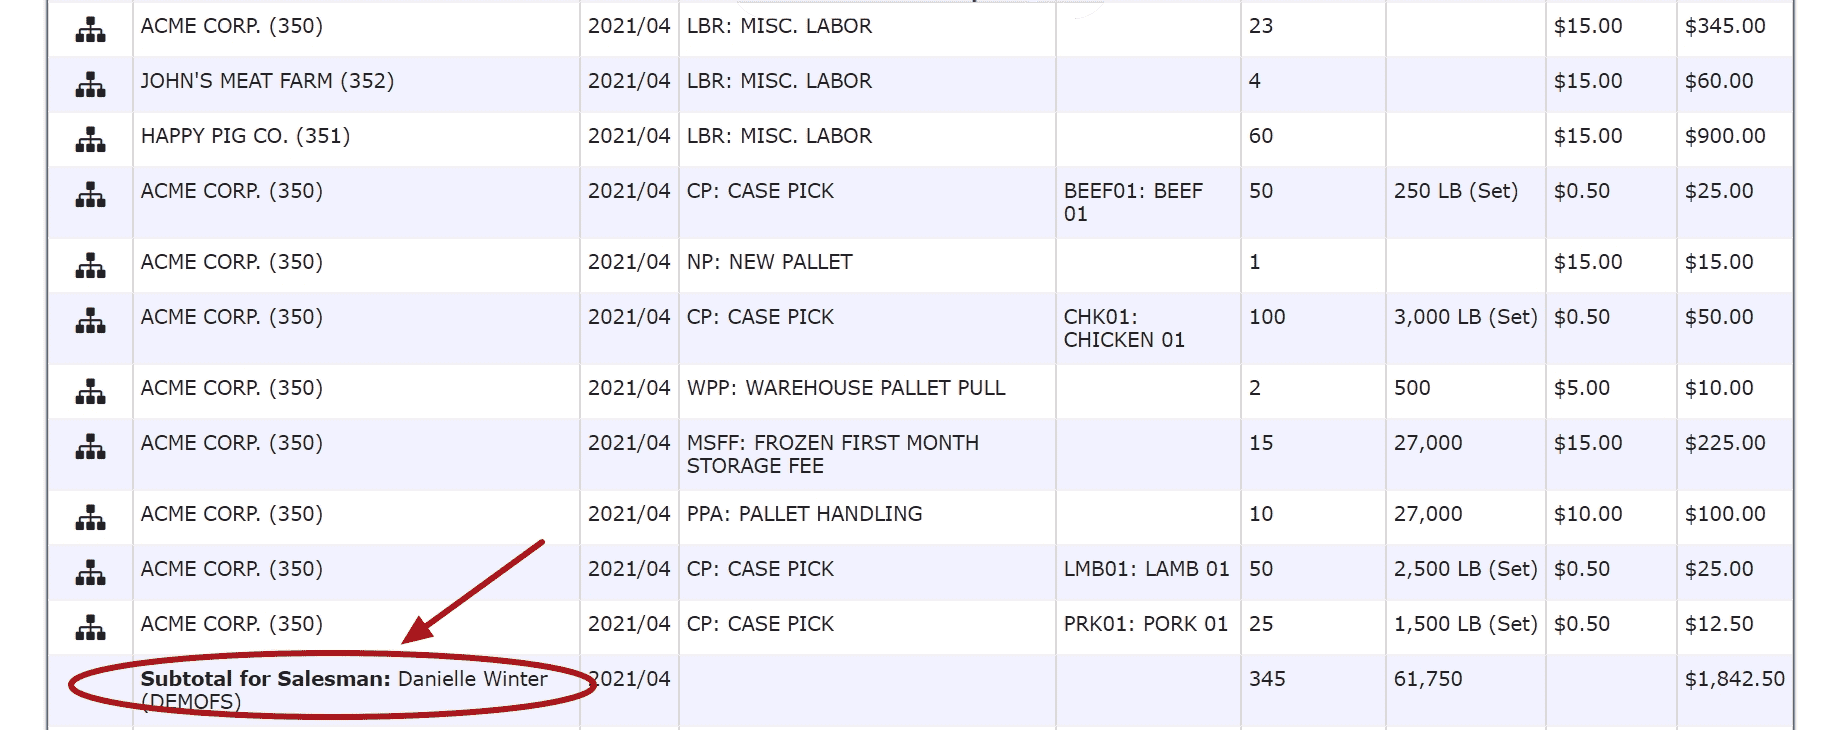
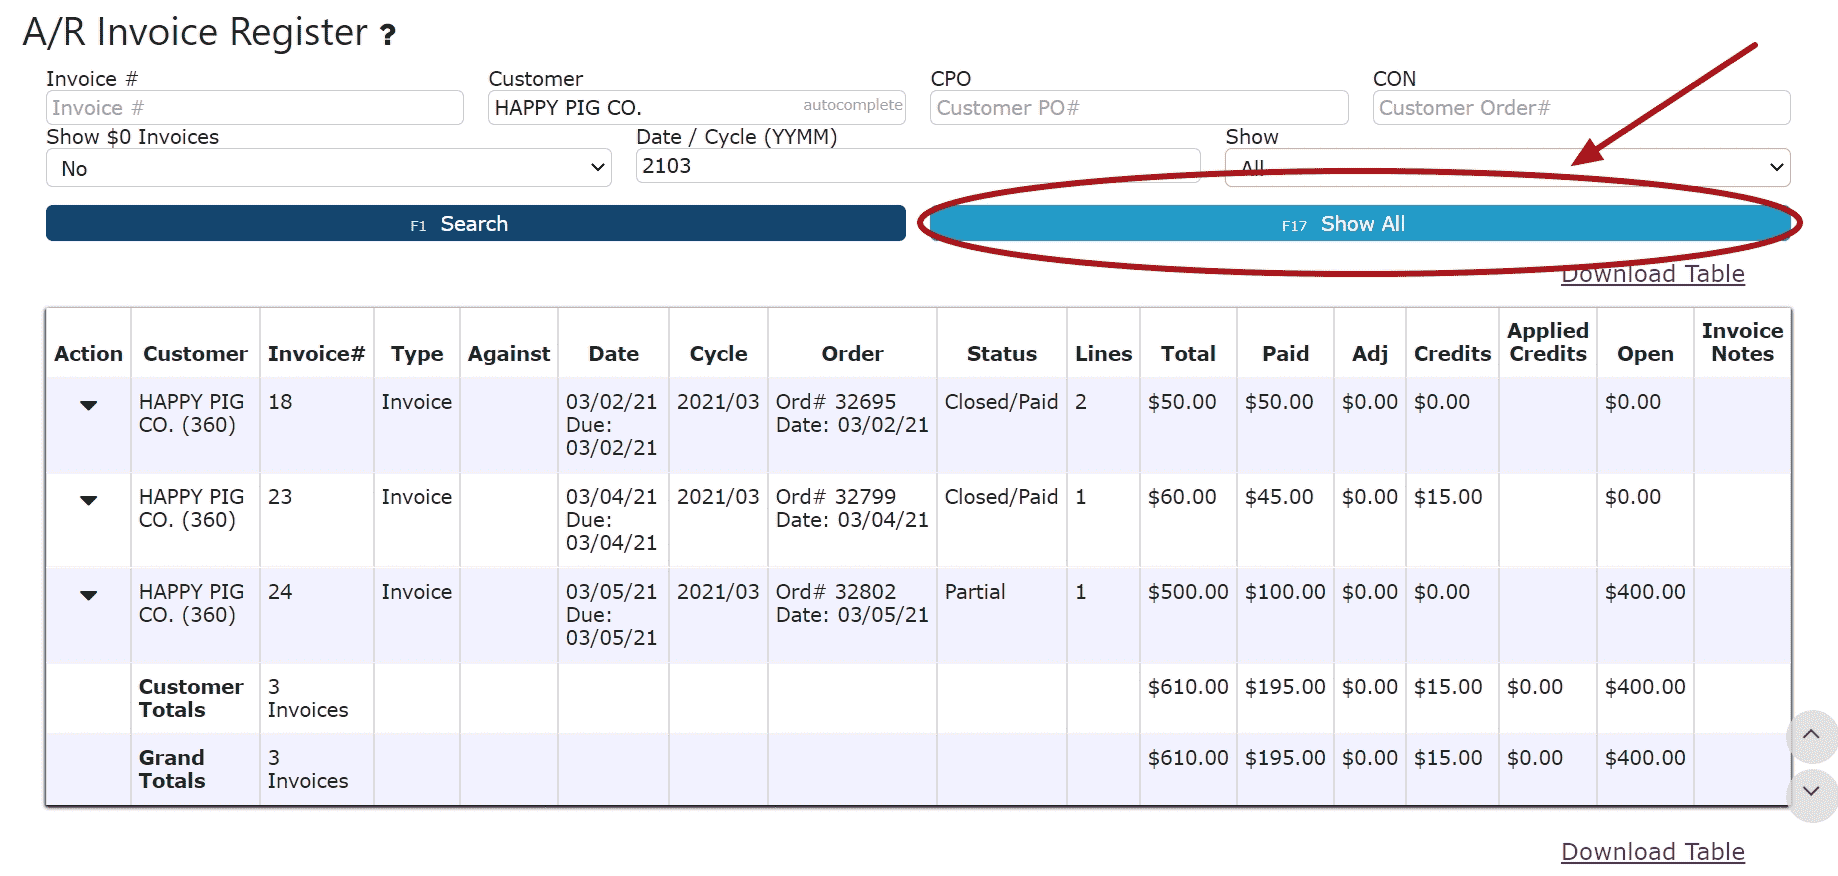
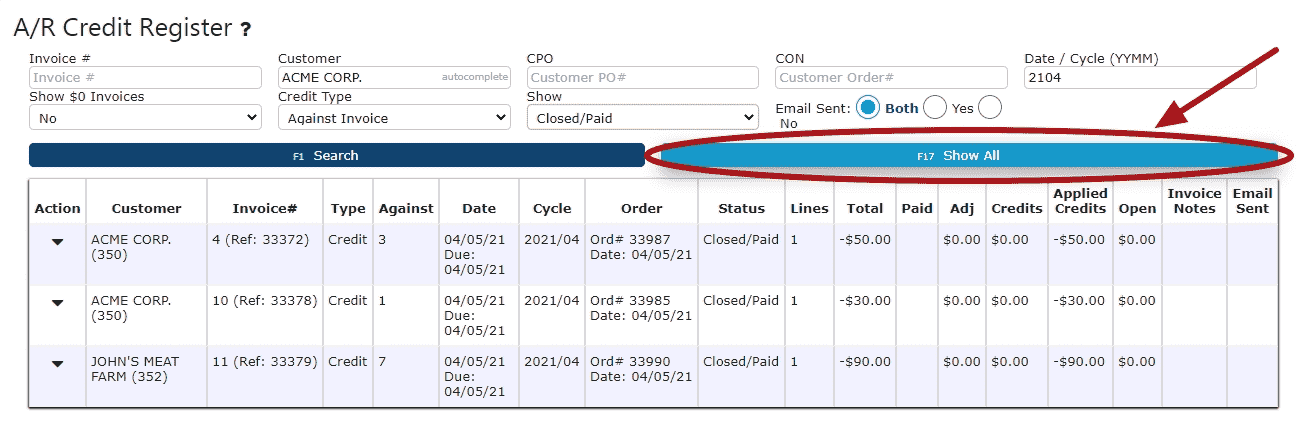
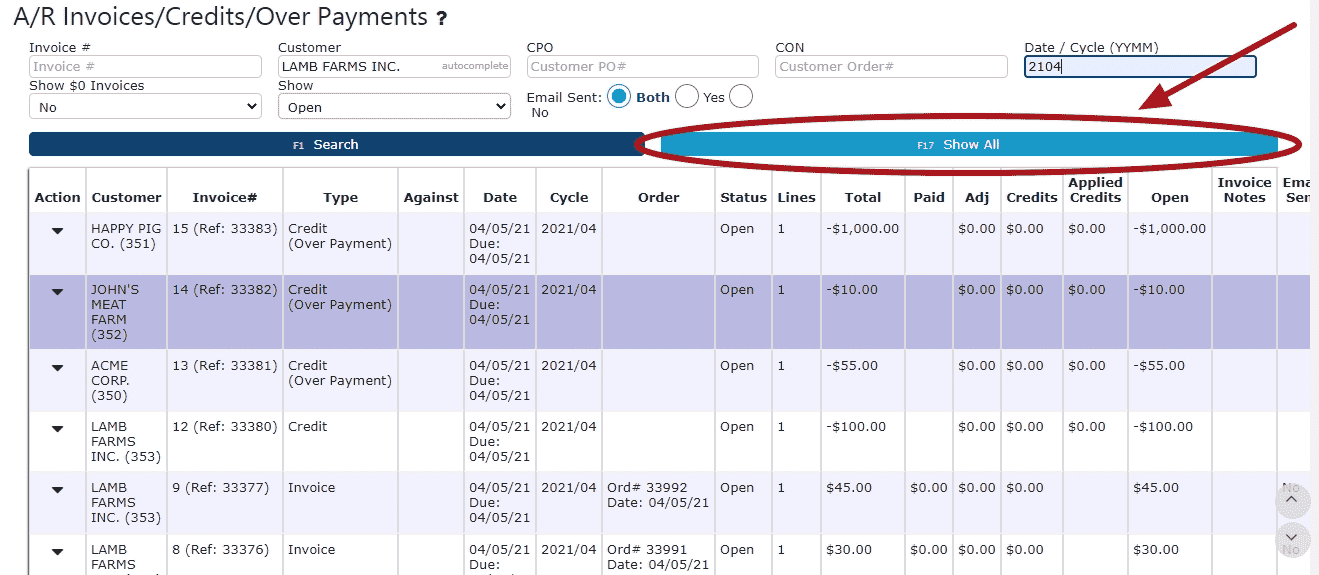
3. Click on the Show All Button to view each subtotal (the subtotal will depend on the Subtotal By selection) and the grand total at the bottom
Note: For the service subtotal selection, entries will be shown by service in descending date order with a subtotal at the end of each service's transactions
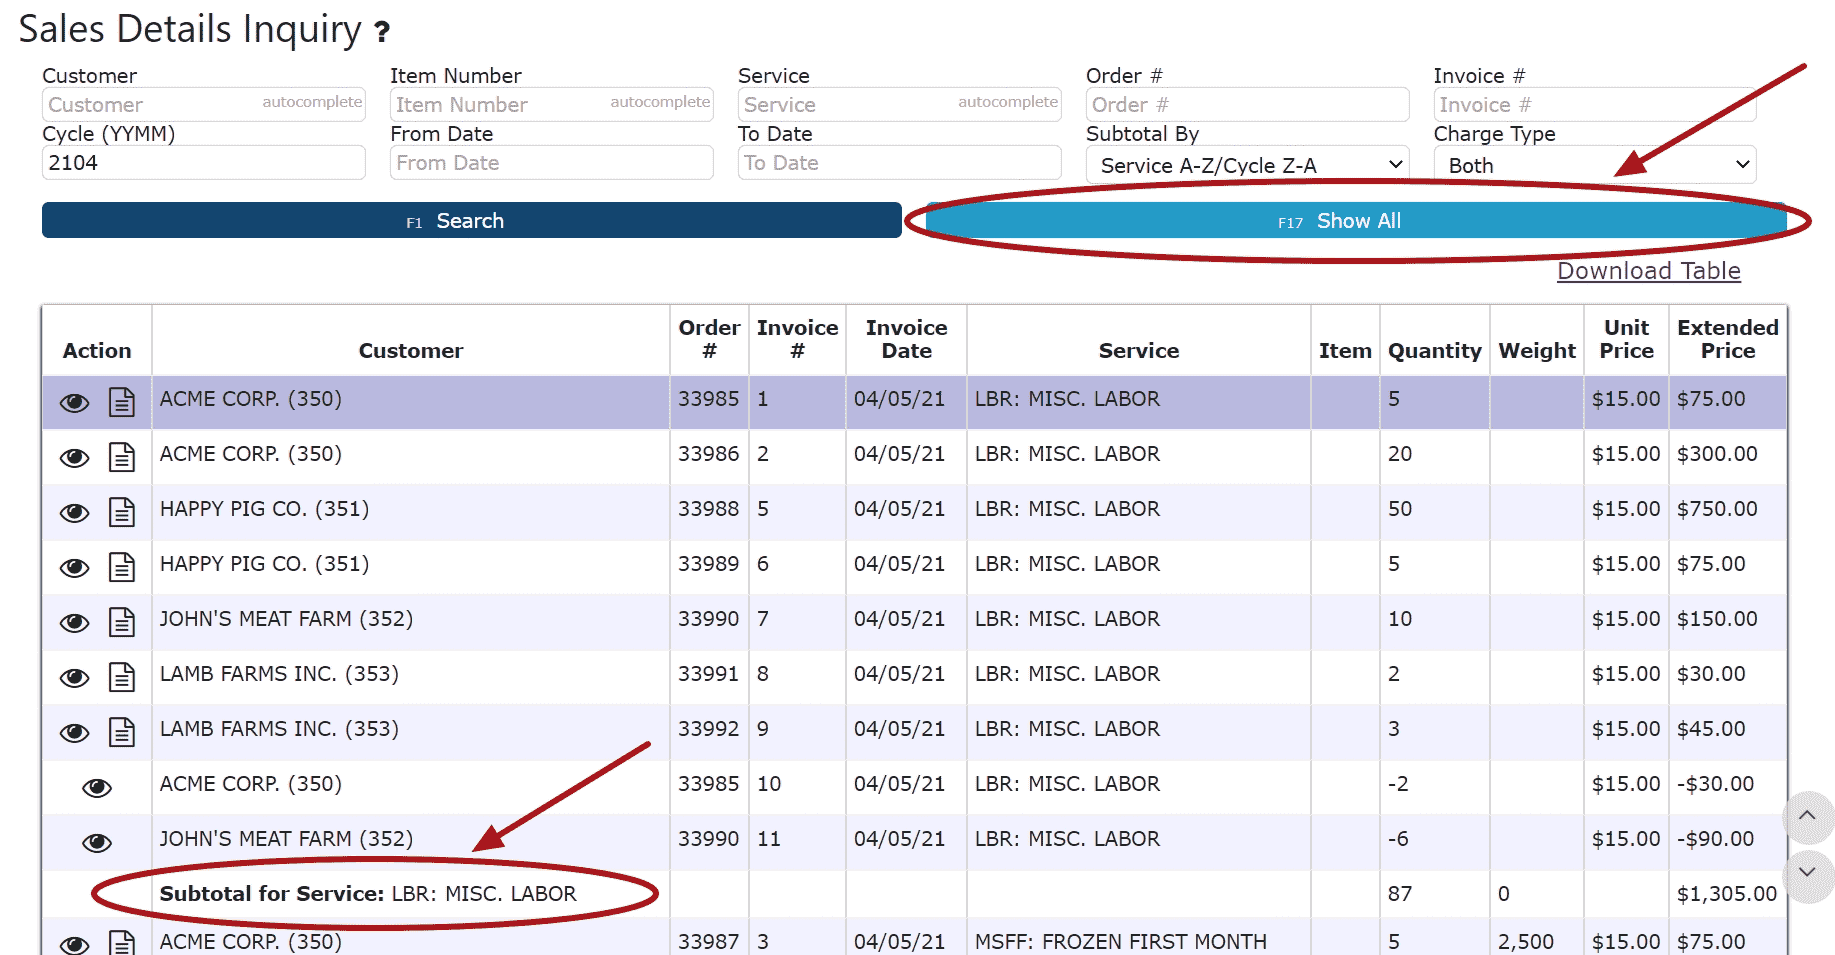
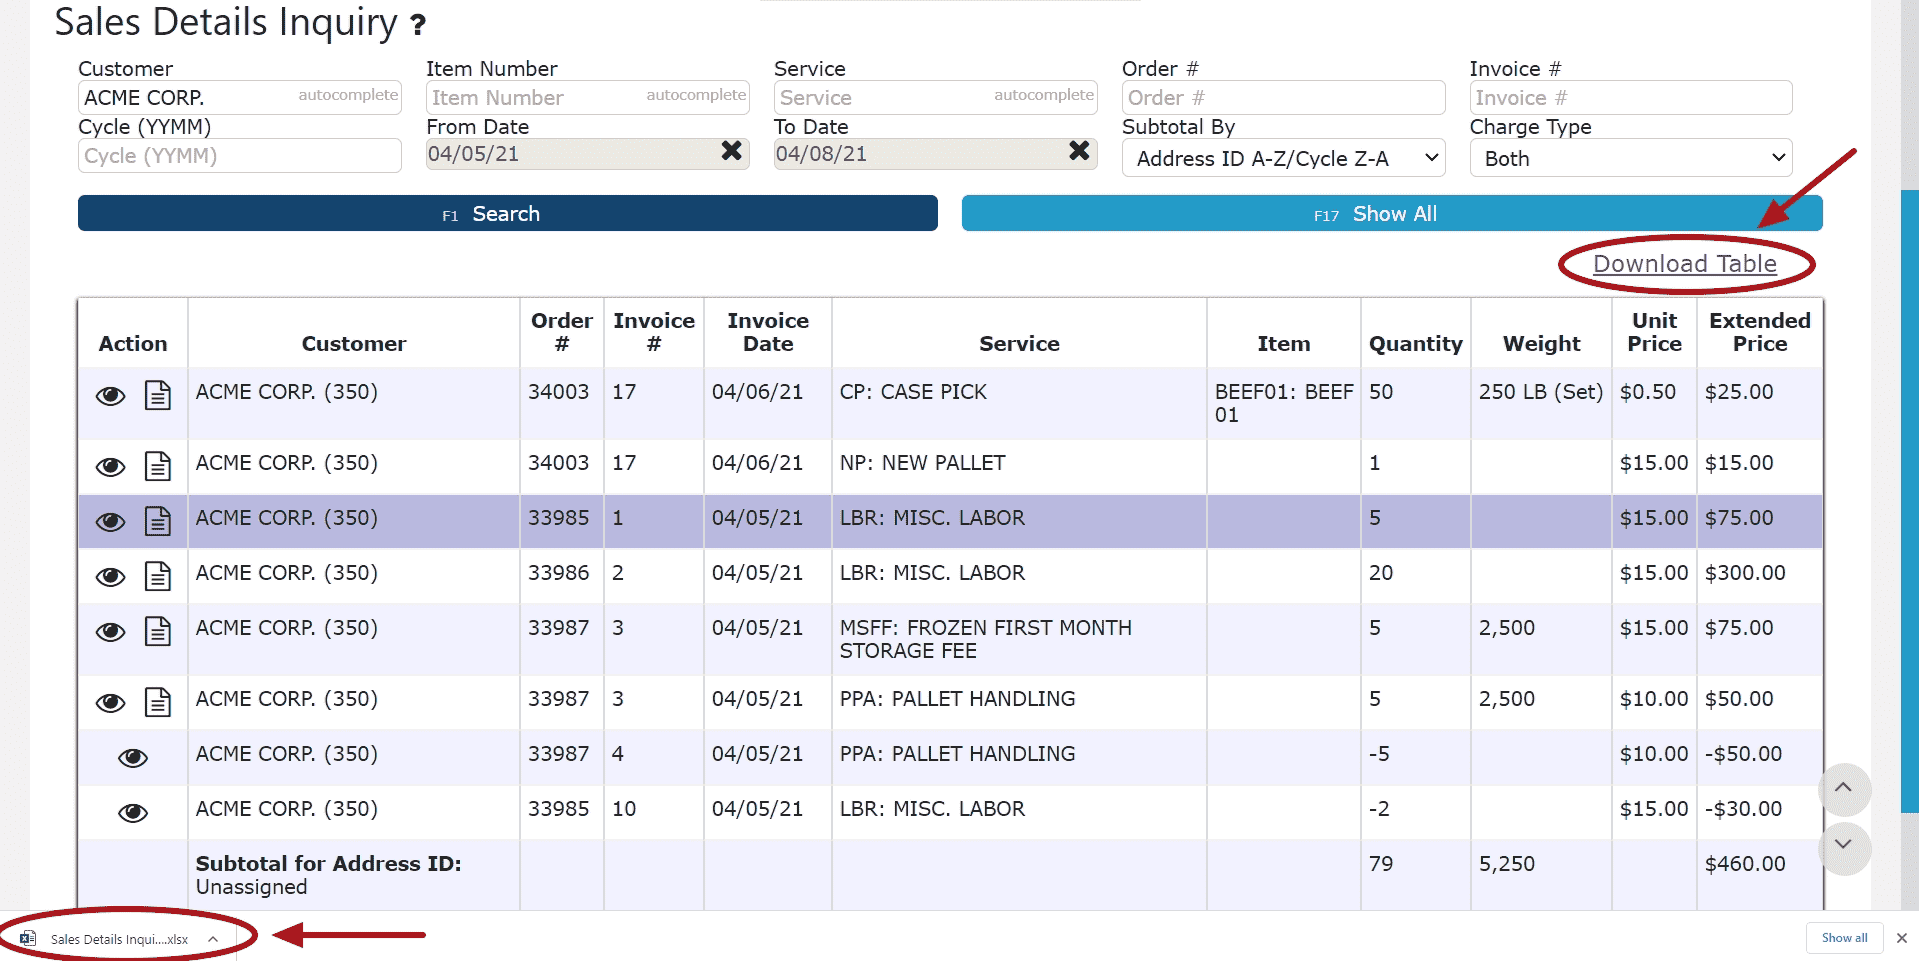
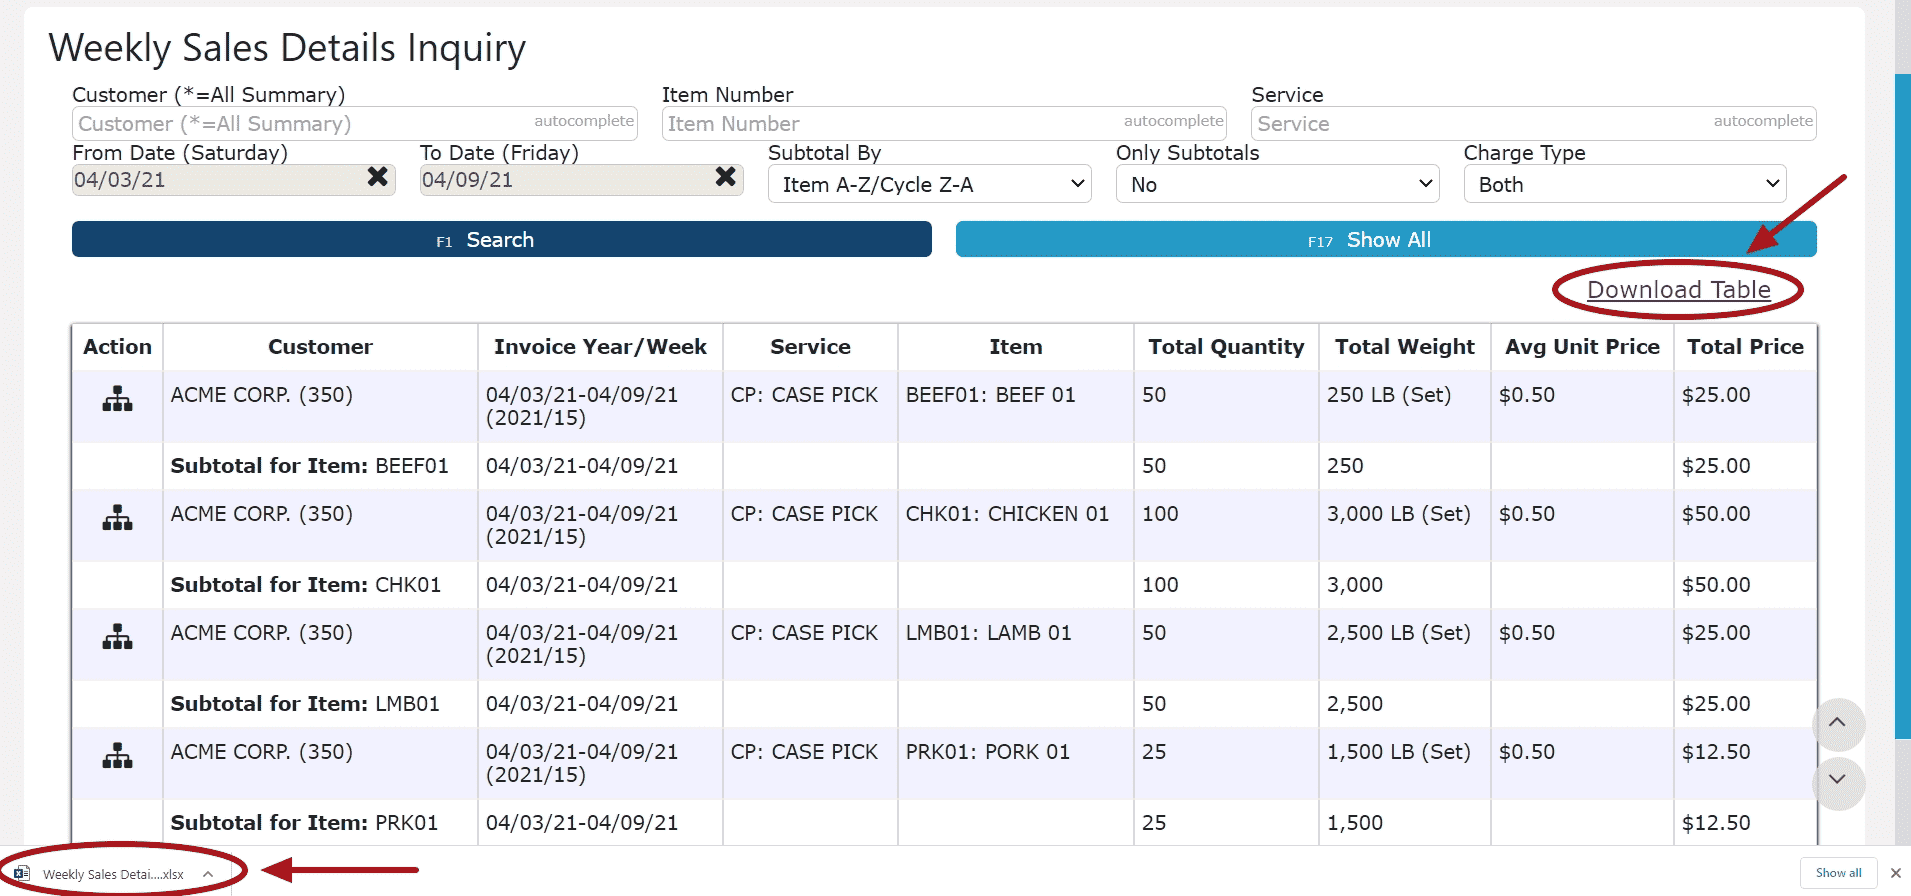
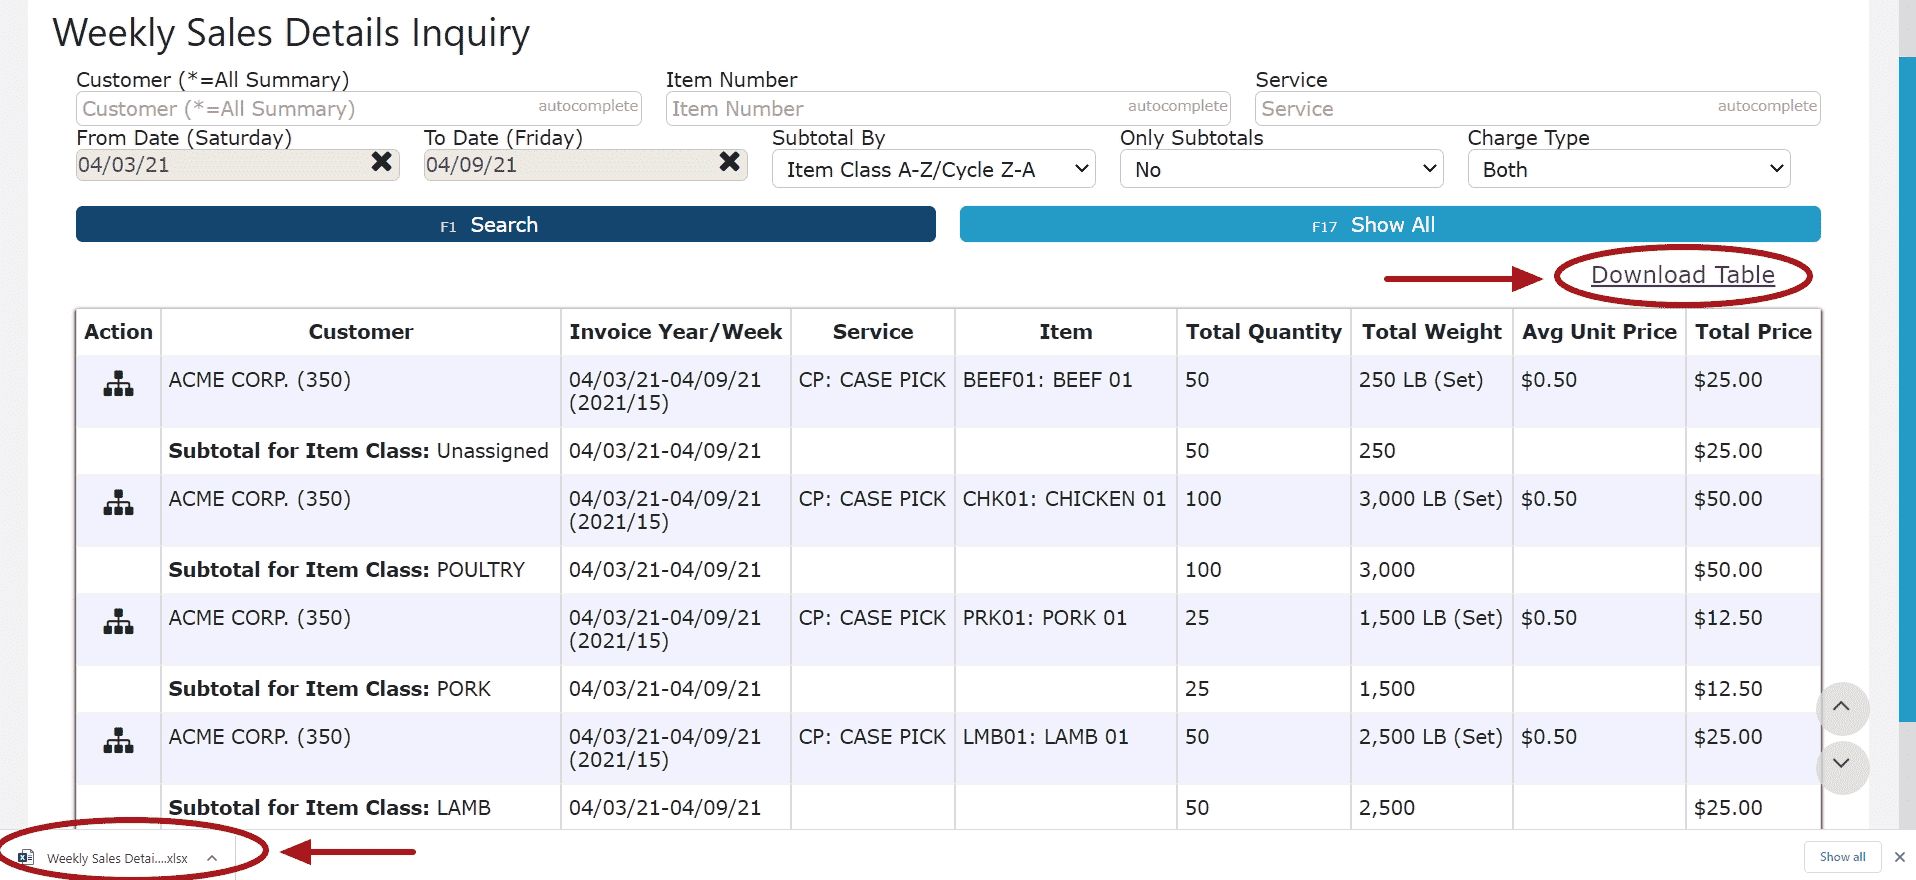
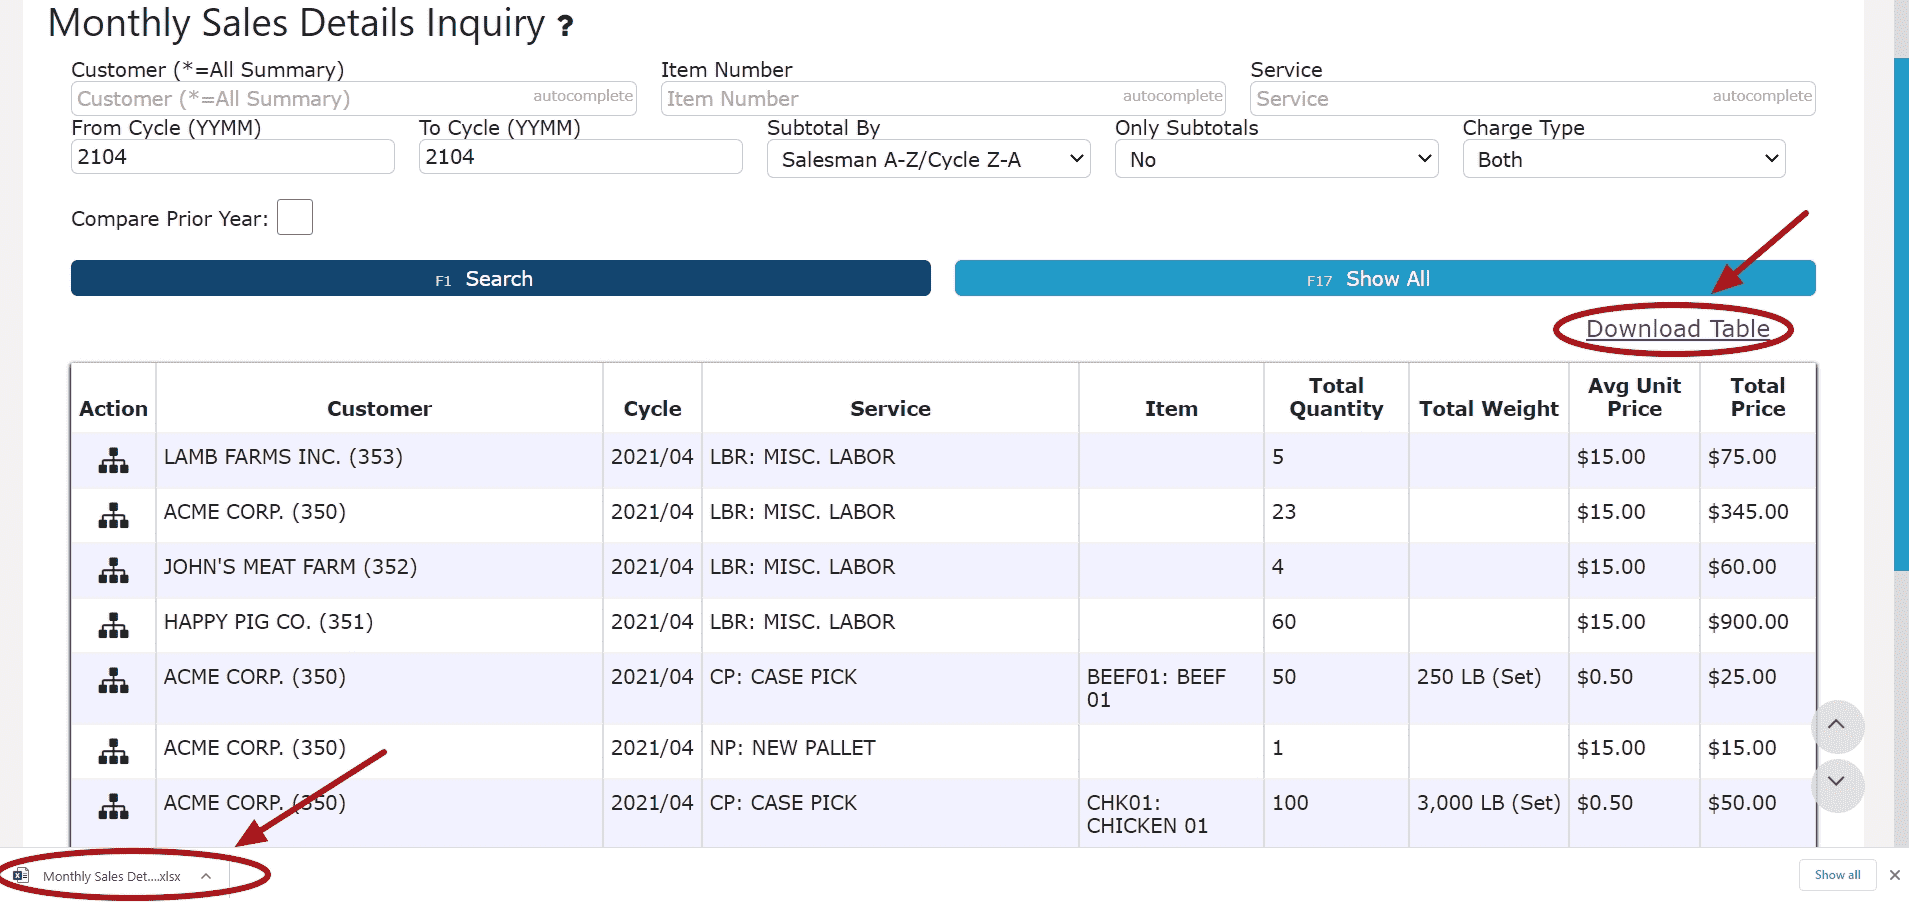
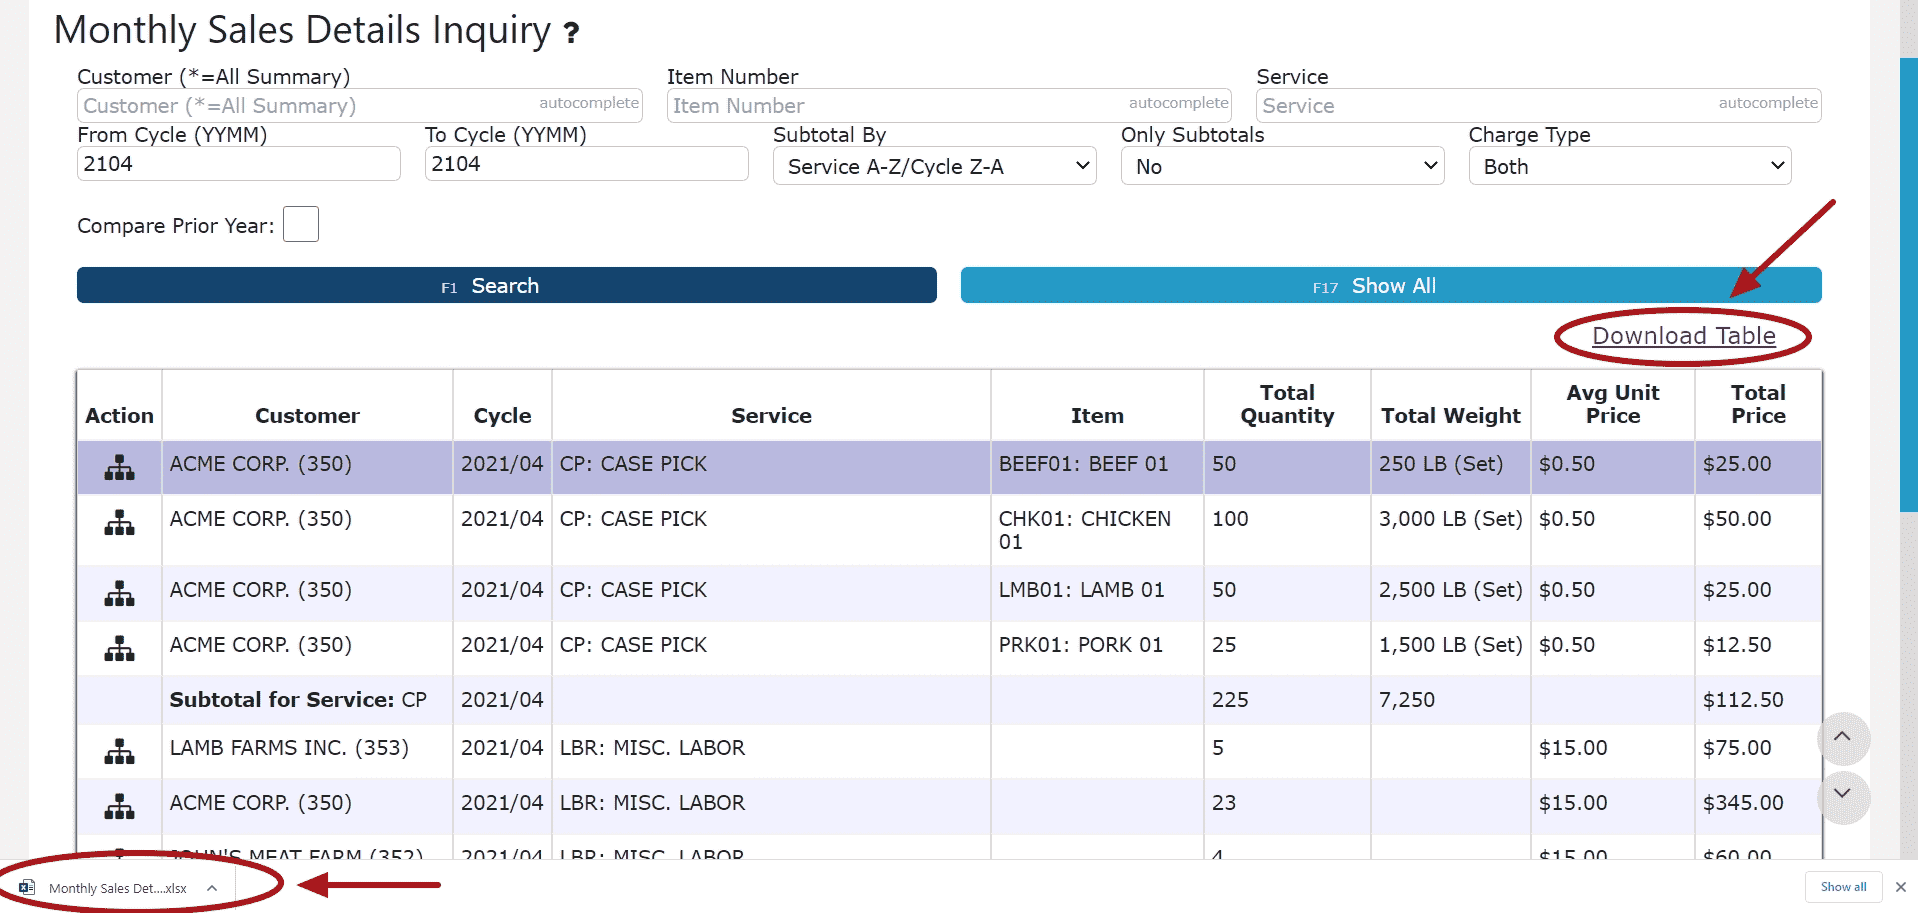
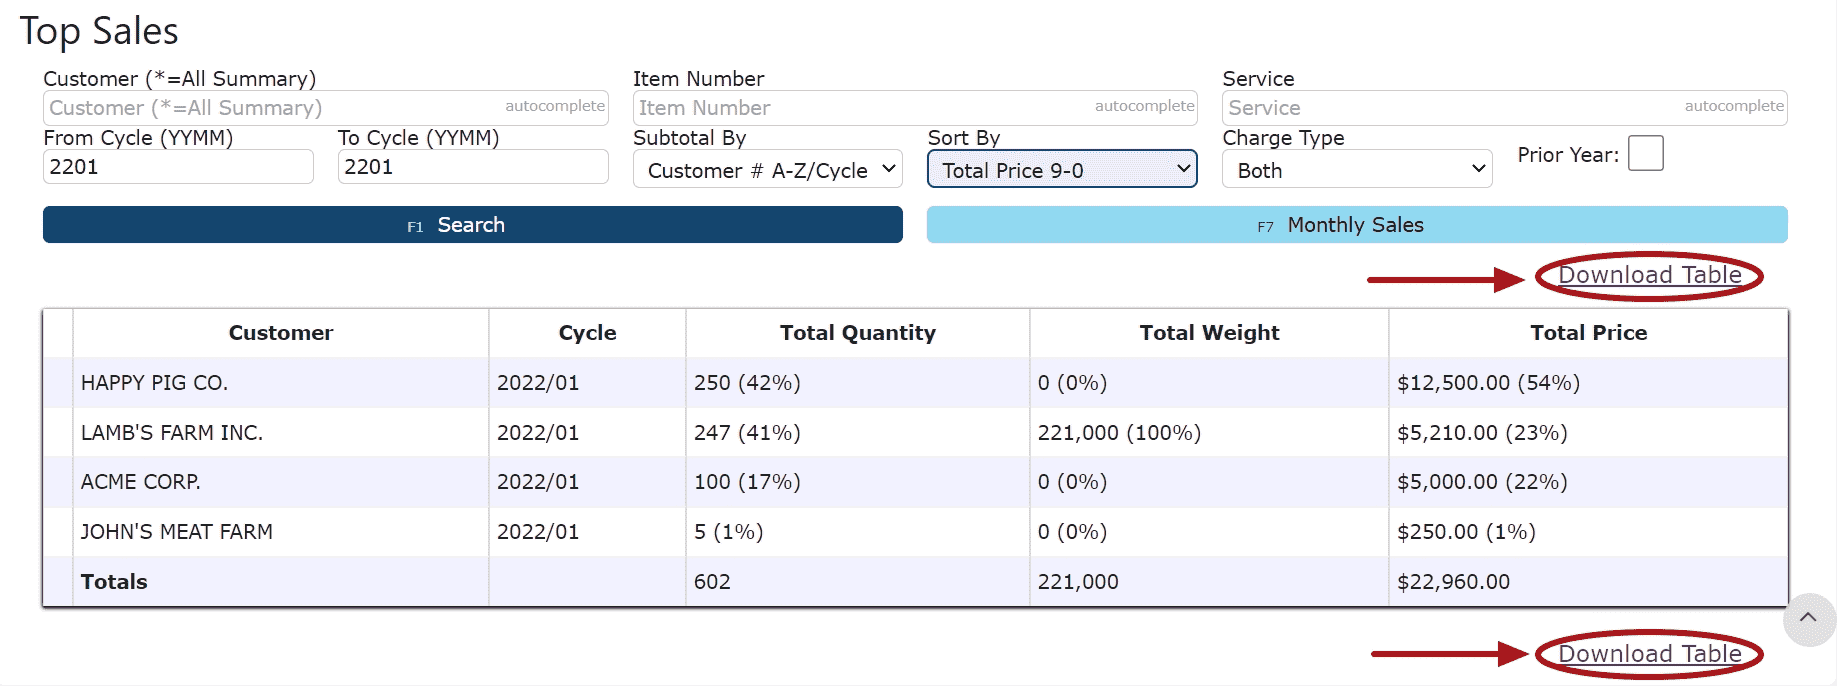
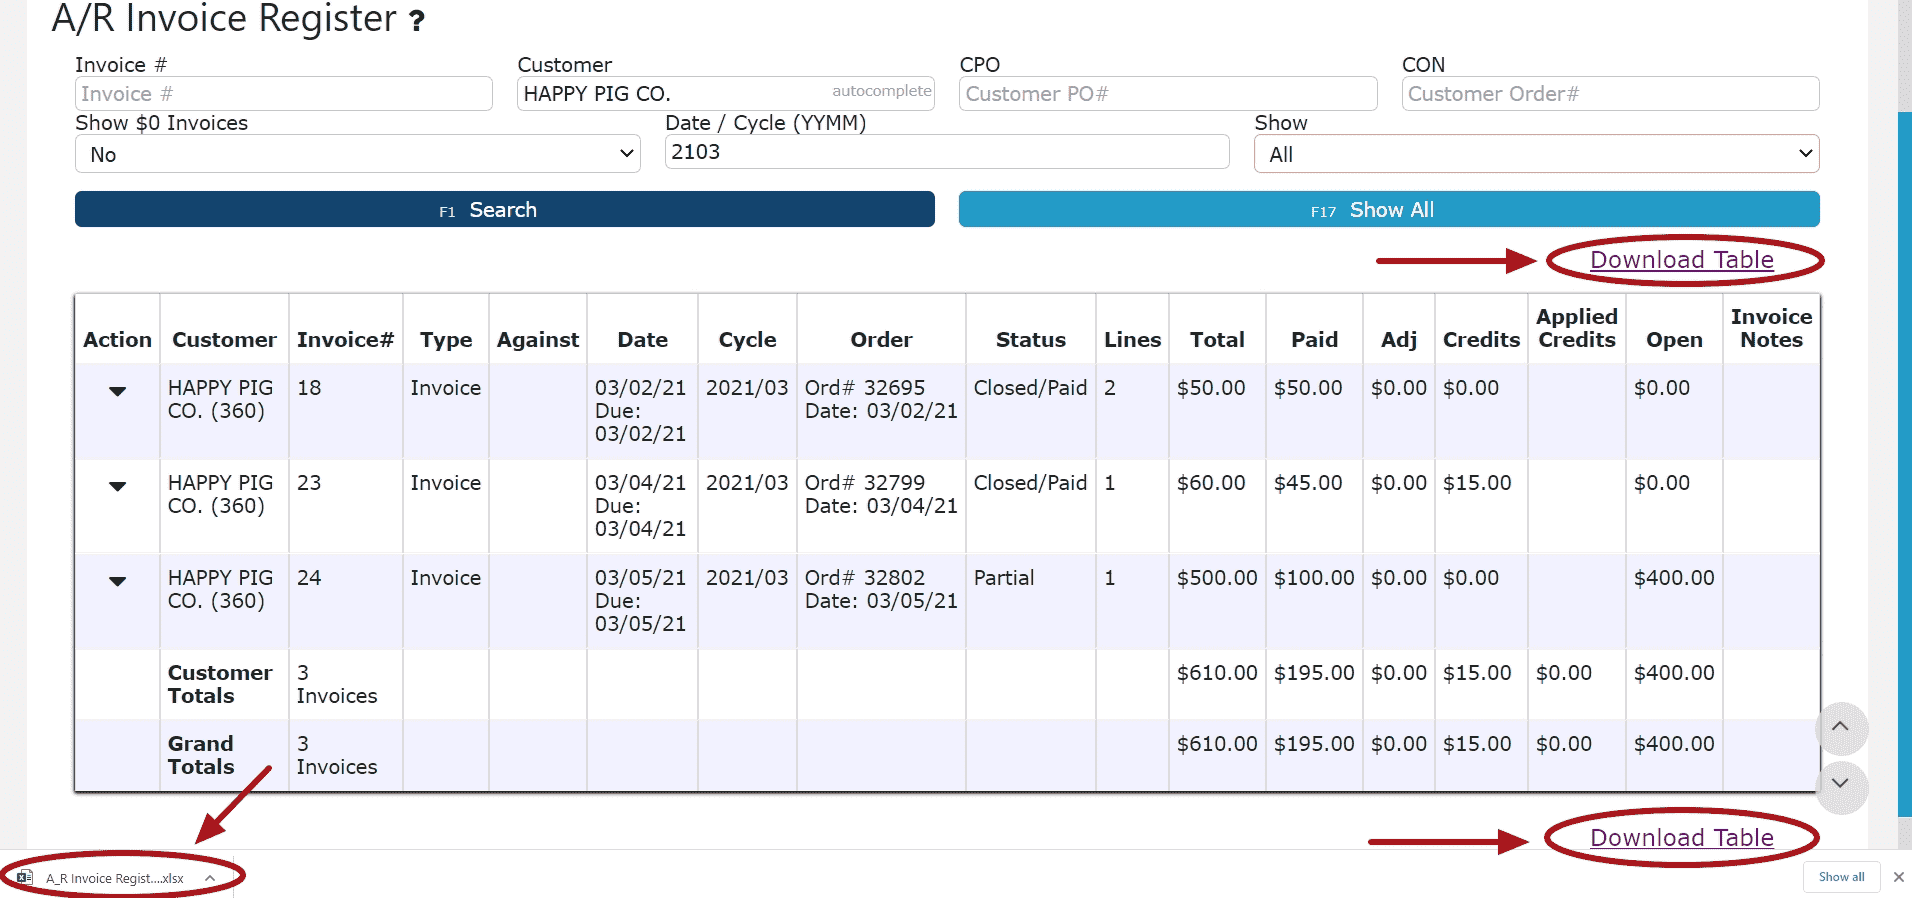
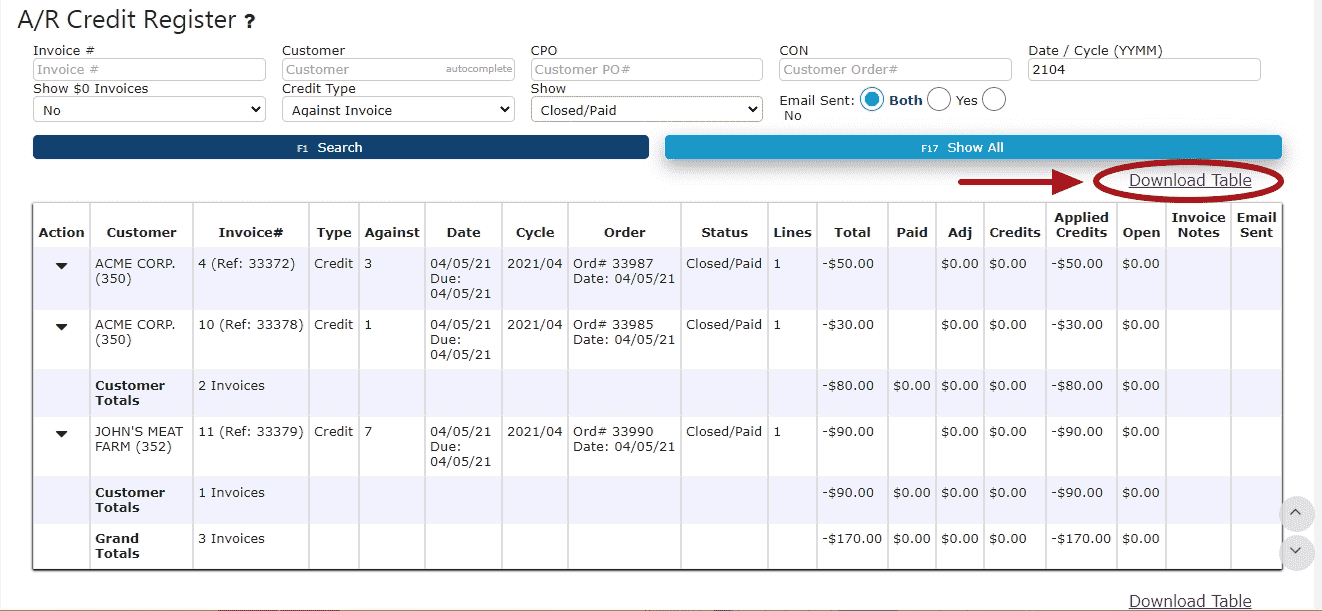
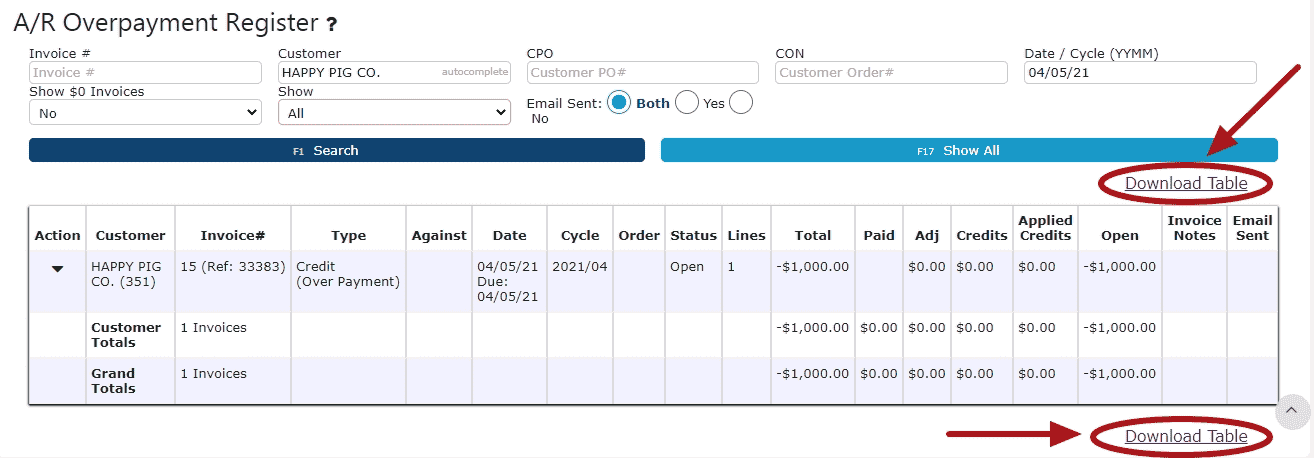
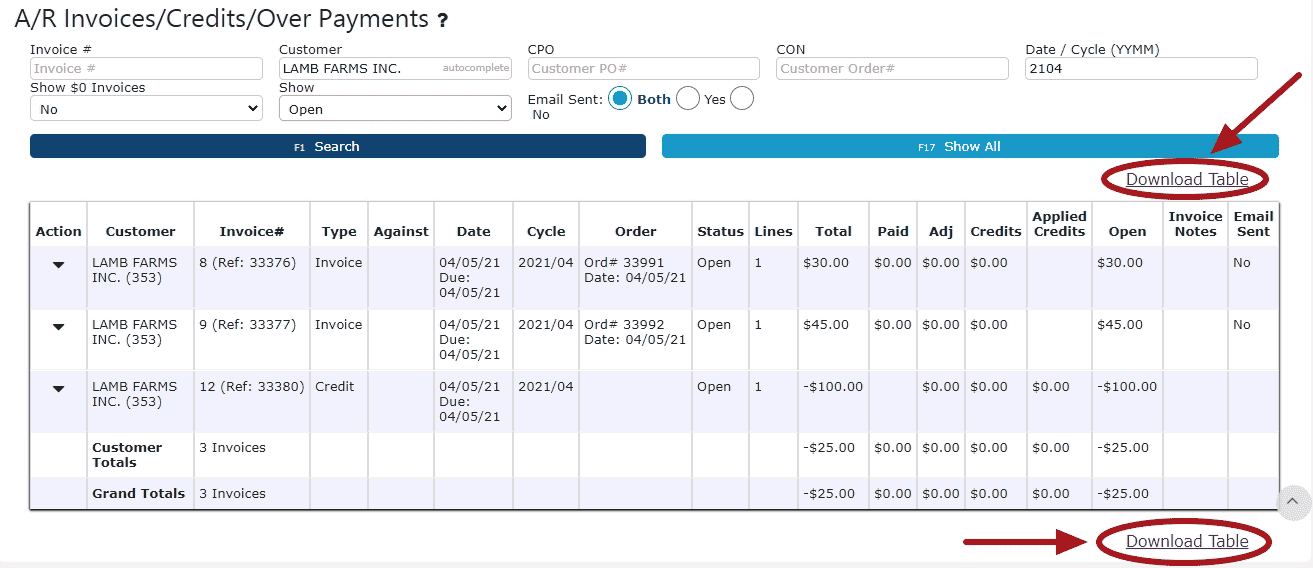
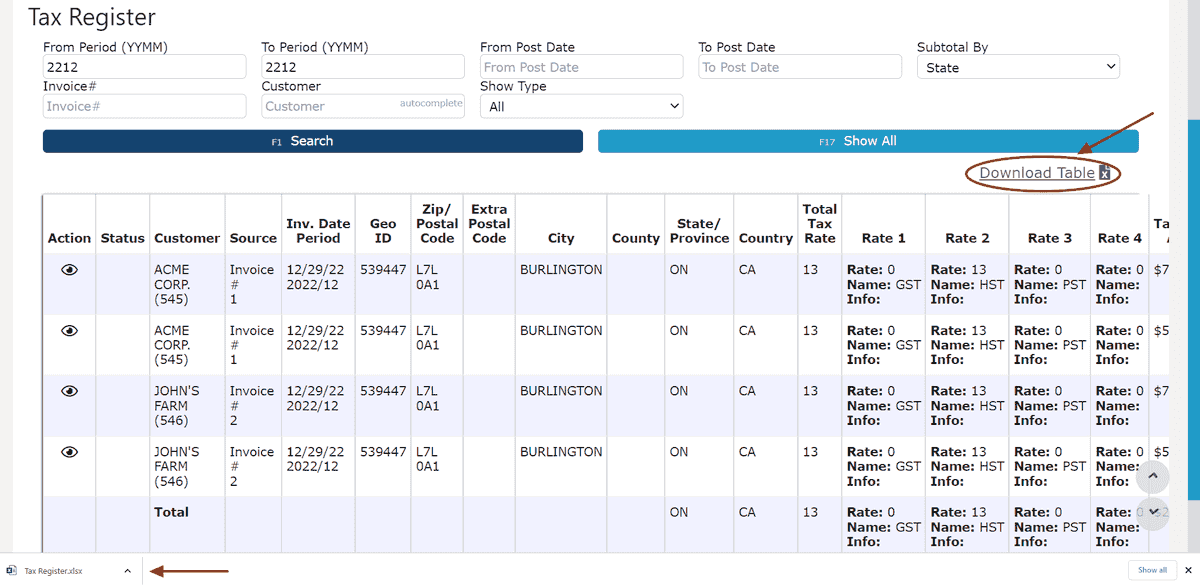
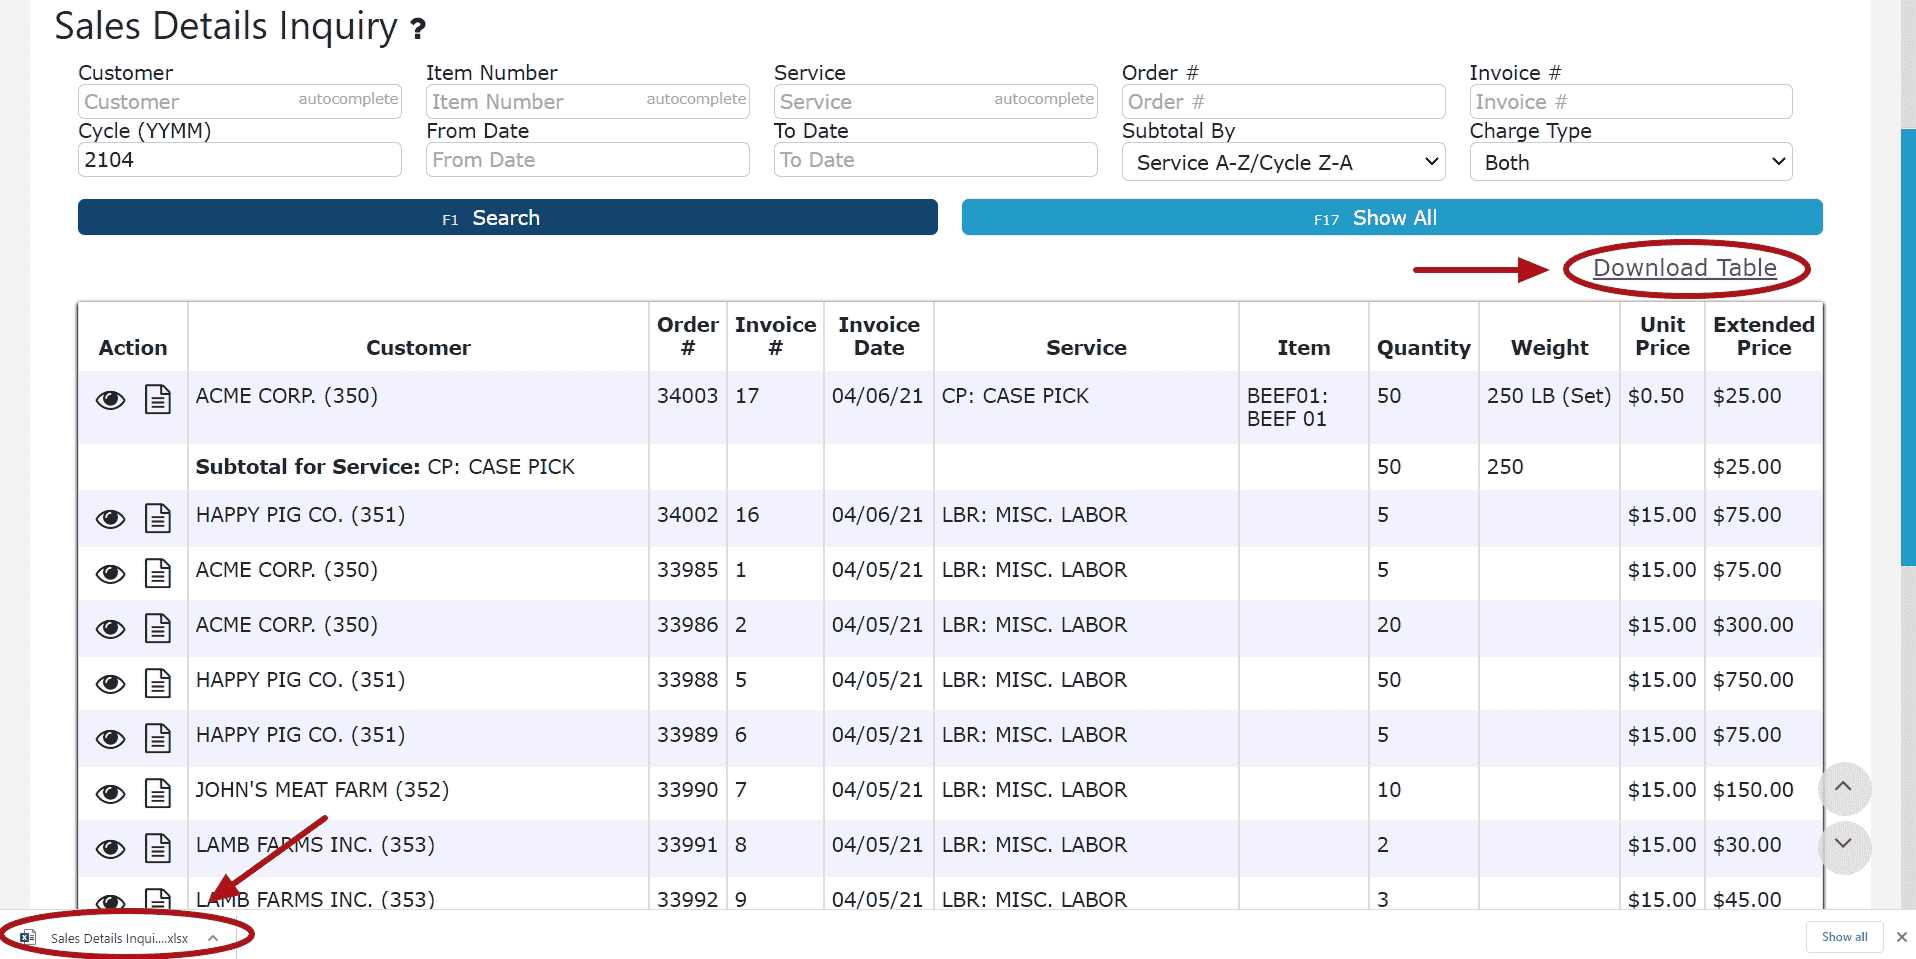
4. Click on Download Table to download an Excel Spreadsheet of the current table
 Example 2: Subtotal by Address ID
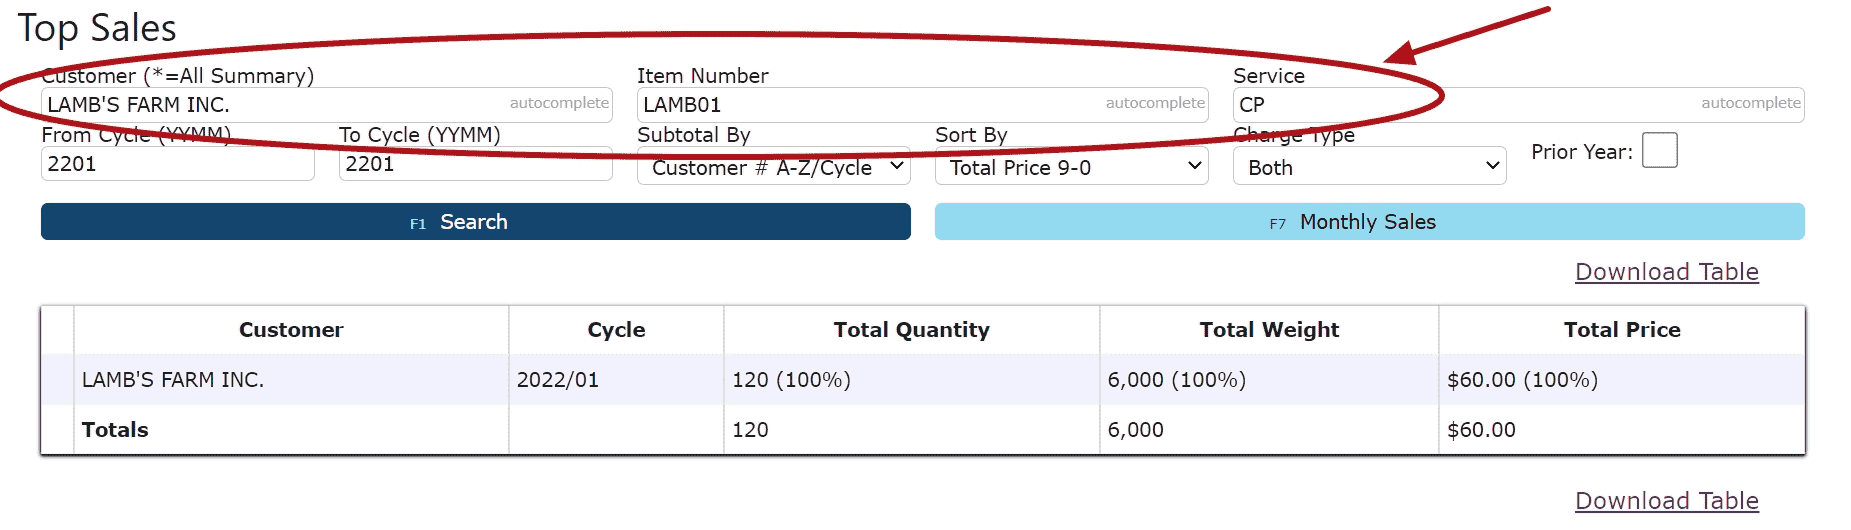
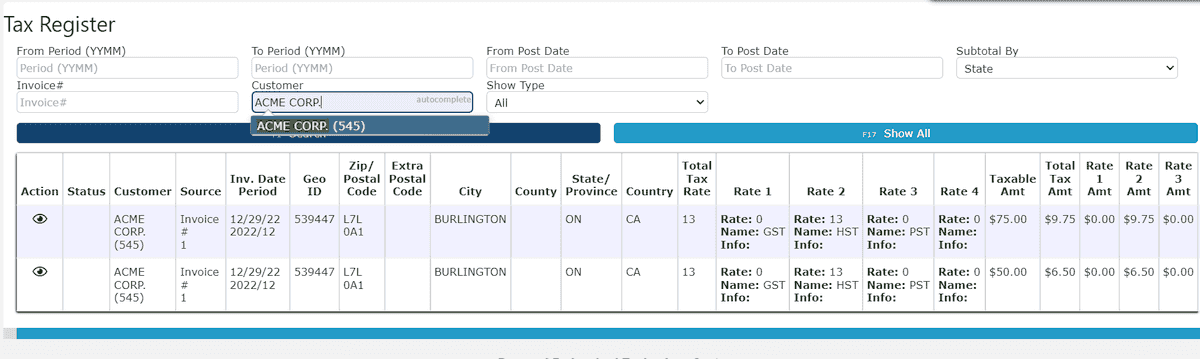
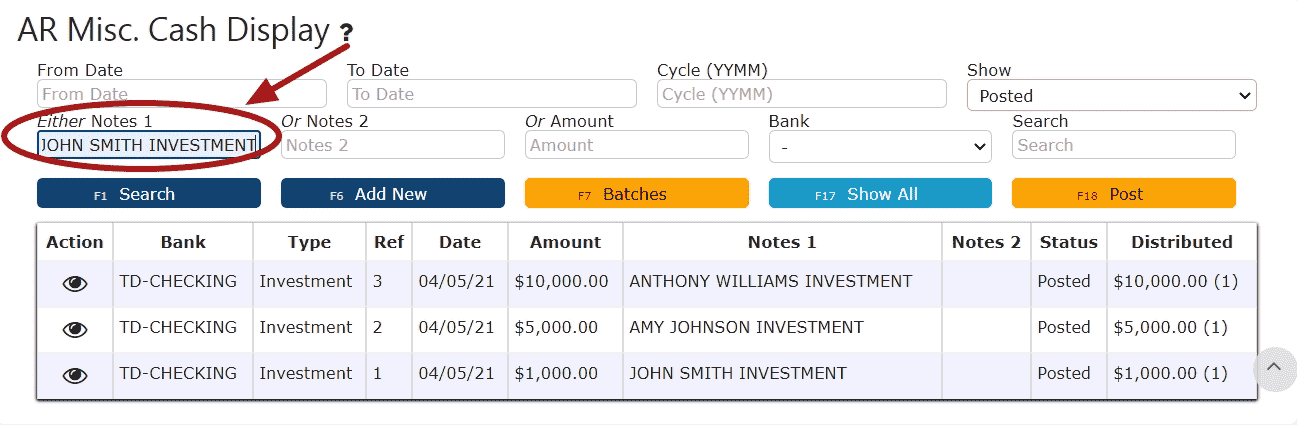
1. Enter a Customer name (Required)
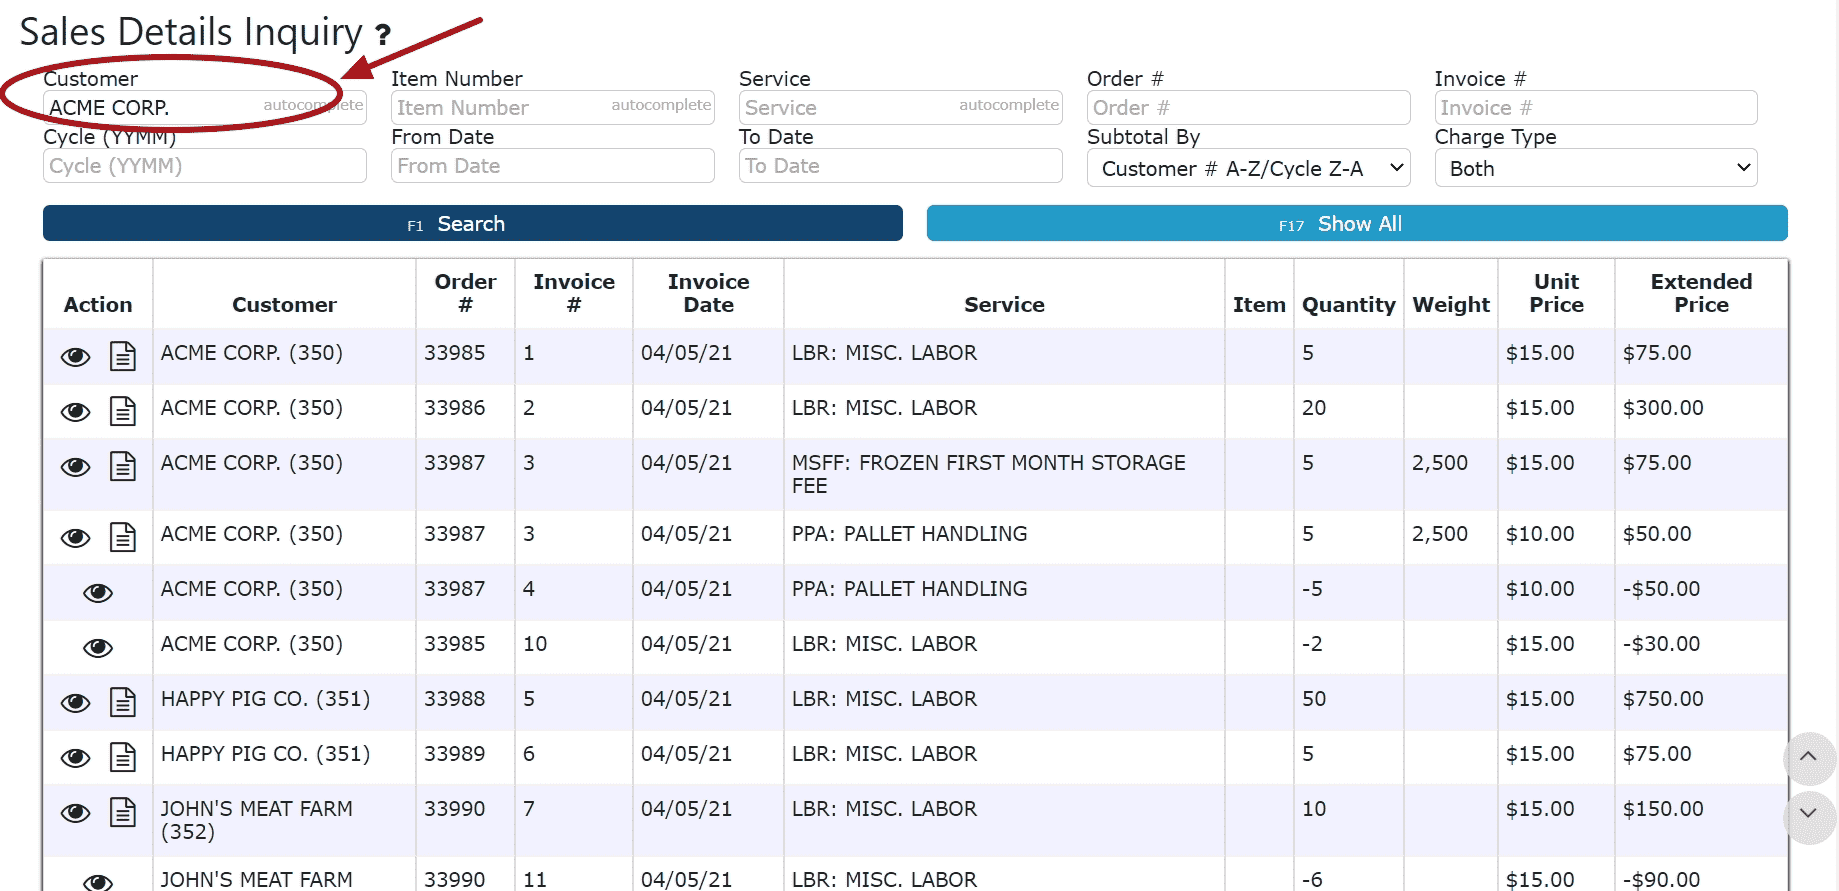
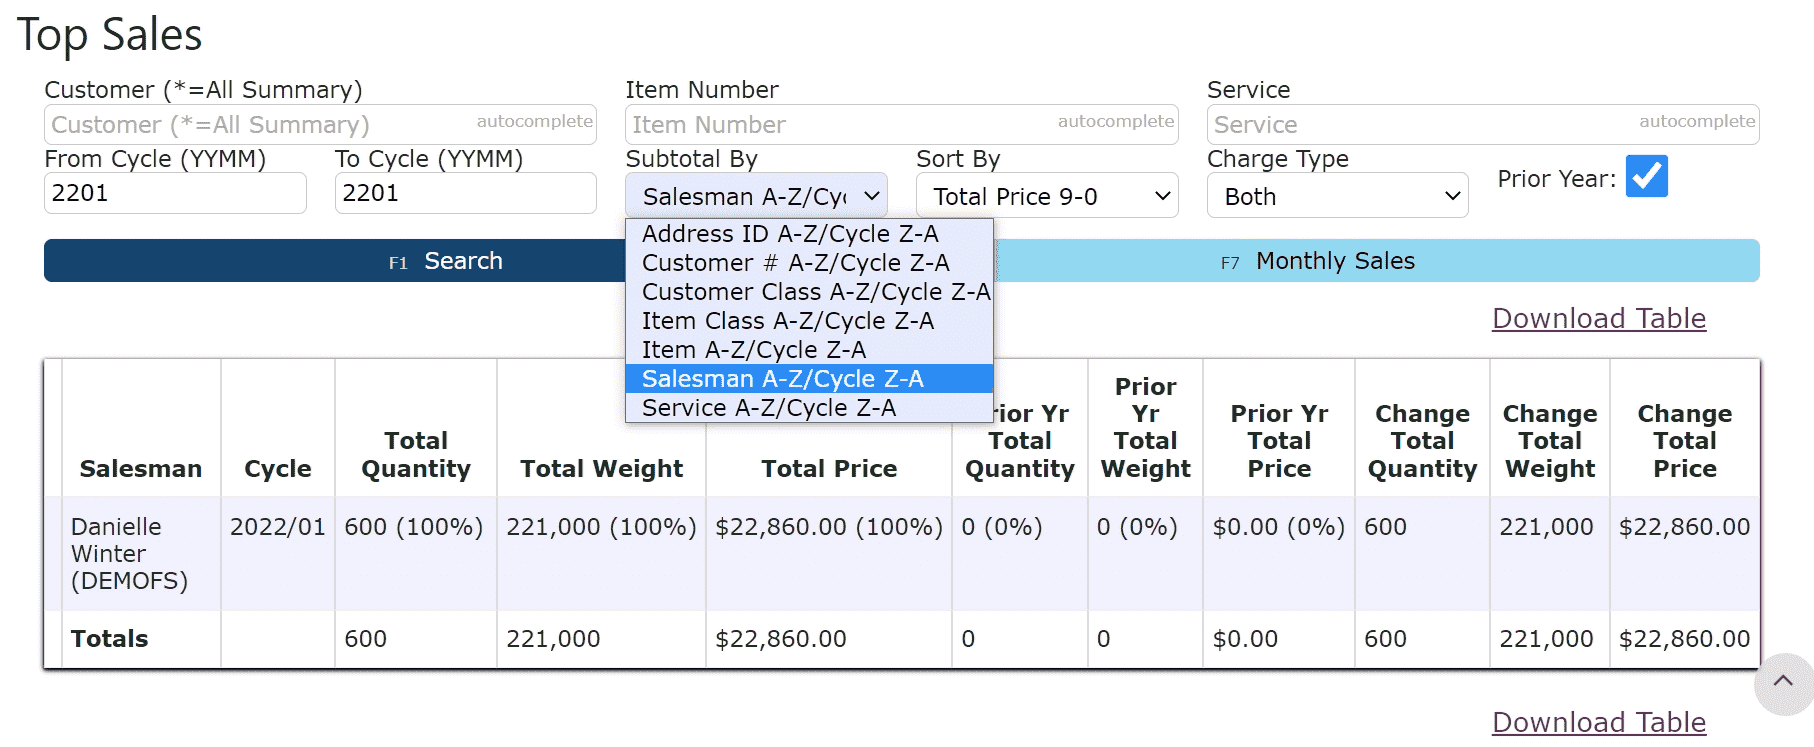
2. Select the appropriate option from the Subtotal By Drop Down
3. Enter either a Cycle or a From/To Date (Required)
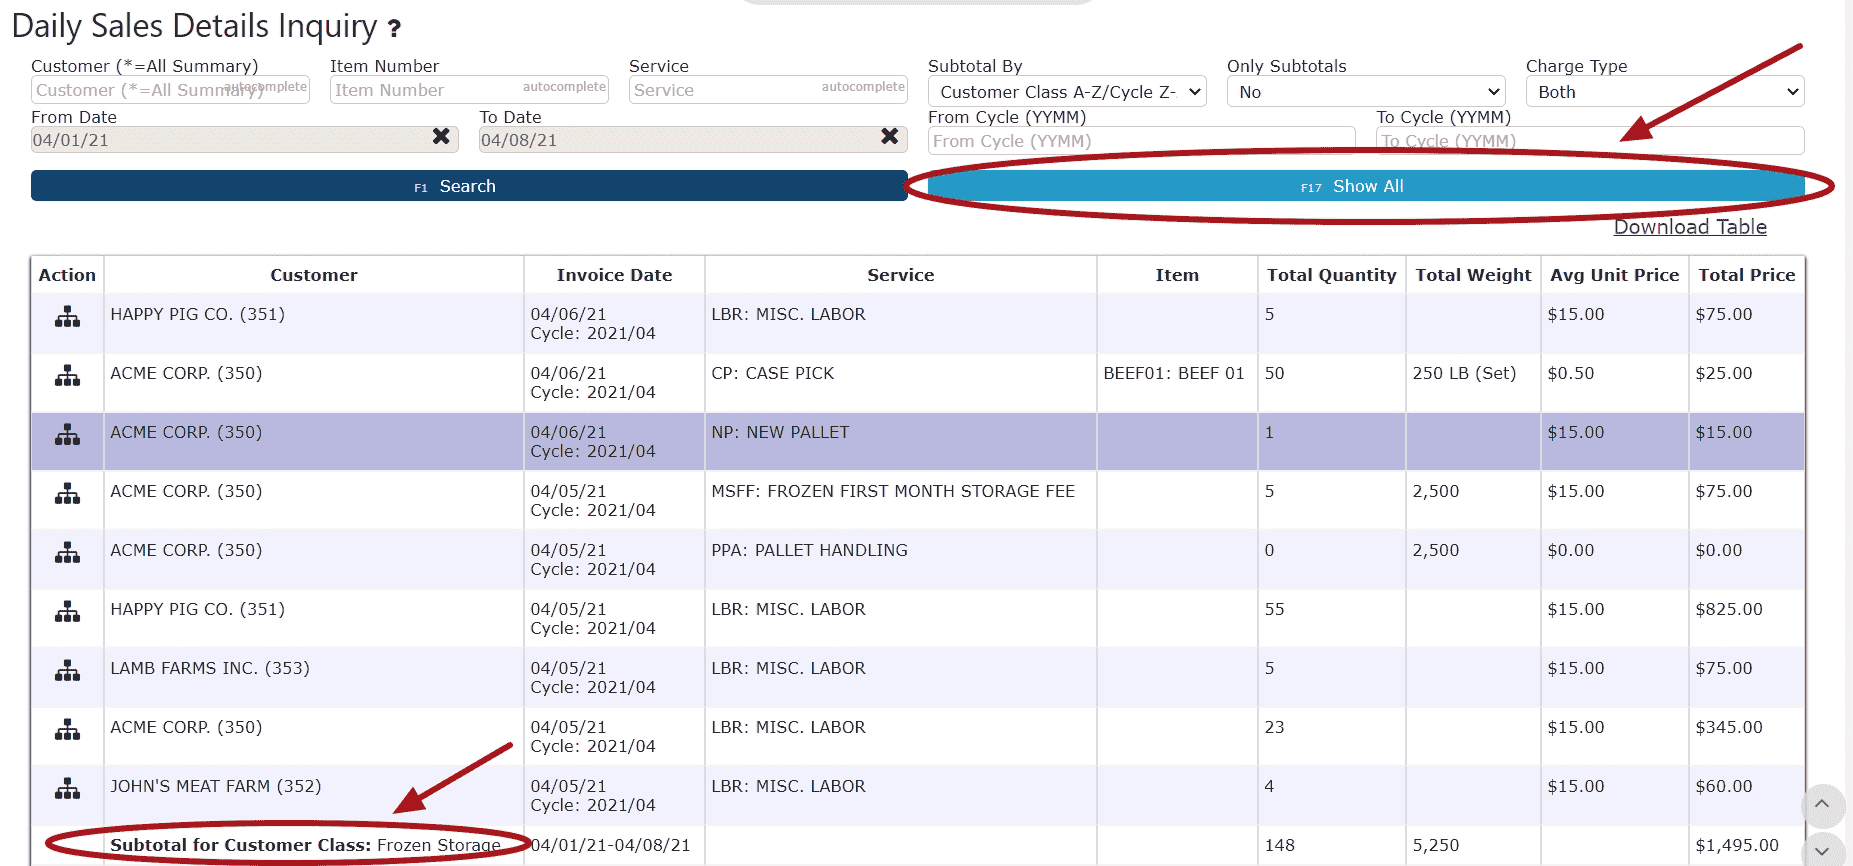
4. Click on the Show All Button to view each subtotal (the subtotal will depend on the Subtotal By selection) and the grand total at the bottom
Note: For the address id subtotal selection, entries will be shown by address id in descending date order with a subtotal at the end of each address id's transactions
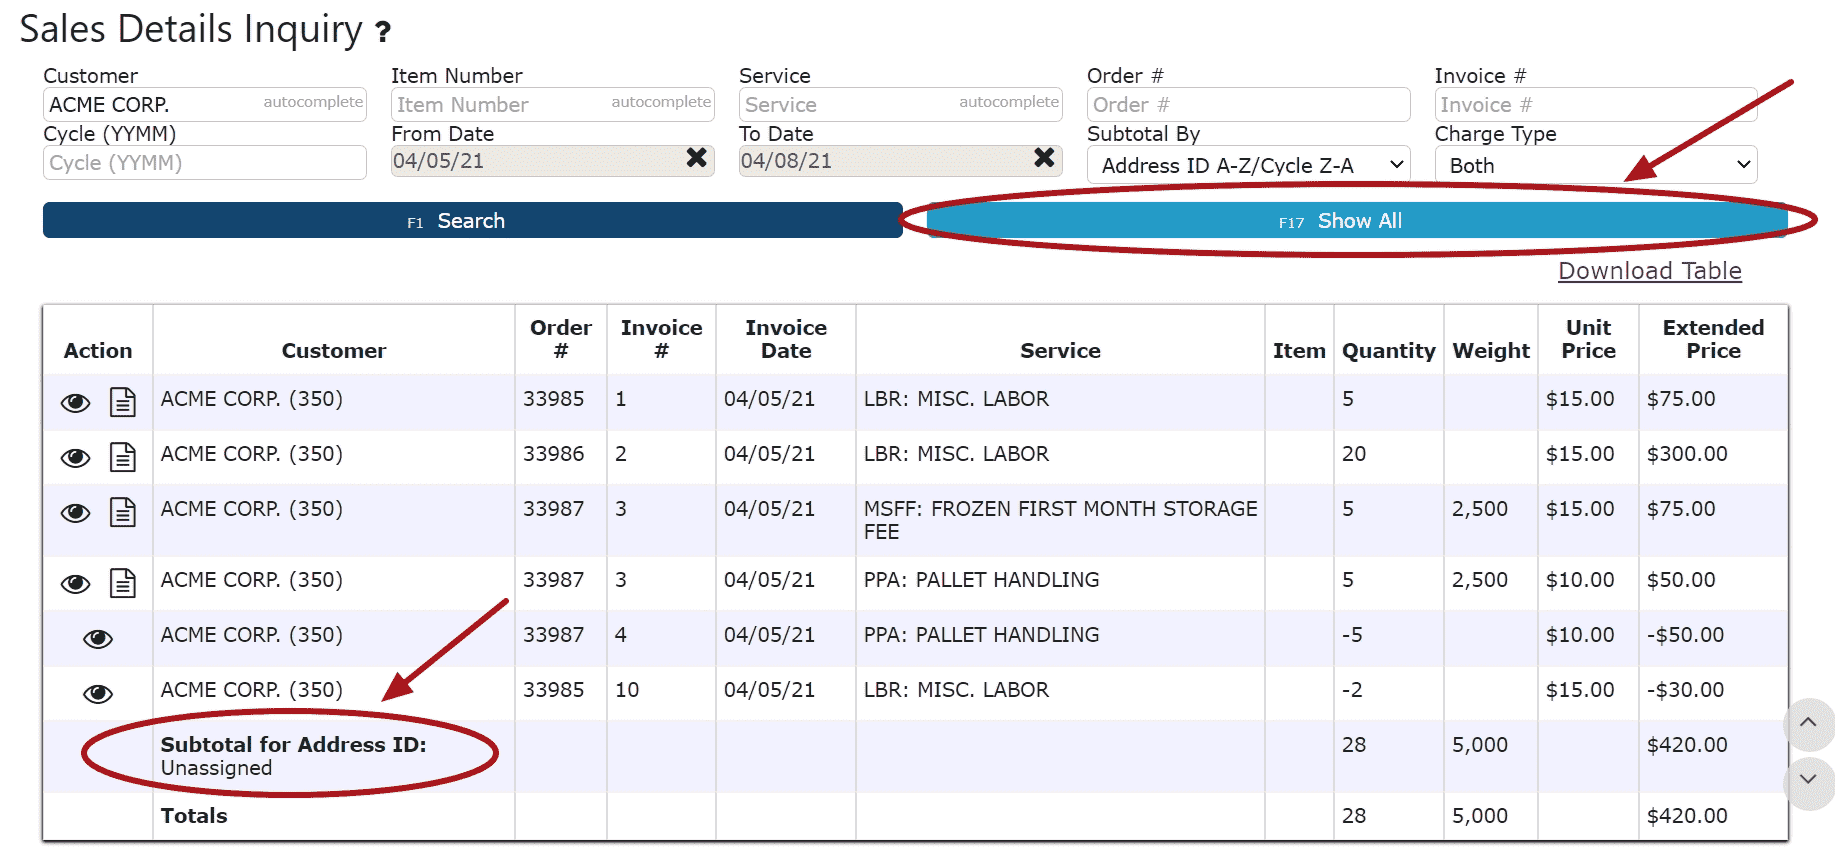
5. Click on Download Table to download an Excel Spreadsheet of the current table